
Quickstart
A hands-on guide that walks through the full workflow, from shooting to report export
This guide walks you through the full workflow: shooting → creating a project → generating an orthomosaic → overlaying blueprints → analysis and measurement → report export.
Detailed settings for each step are covered in the individual guide pages. The goal here is to get through the whole workflow once, end to end.
1. Shoot
Analysis quality in CRITIR depends heavily on the captured data. Keep the following points in mind before heading to the site.
1-1. Shooting essentials
- 70–80% overlap — capture images so that adjacent shots overlap sufficiently. This directly affects the accuracy of orthomosaic generation (SfM)
- Face the wall head-on — avoid extreme oblique angles; shoot as perpendicular to the wall surface as possible
- Cover everything in a grid pattern — sweep the surface top to bottom and side to side without gaps
- Do not use zoom — changing the field of view can reduce SfM accuracy and cause alignment problems with the infrared images
- Use one folder per wall surface — keeping each wall you want as an orthomosaic in its own folder makes later processing much easier
Overlap is measured on the visible images. Visible images are usually captured with a wider field of view than infrared images, so sufficient overlap is achieved naturally.
Renaming files can break the pairing between infrared and visible images. Keep the captured data under the camera's default file names.
1-2. Tips for generating clean orthomosaics
In addition to the shots needed for a normal inspection, capture wide-area shots of the target while gradually moving away from it where possible. Adding wide-area images improves SfM reconstruction accuracy, making it much more likely that you get a clean orthomosaic with few visible seams.
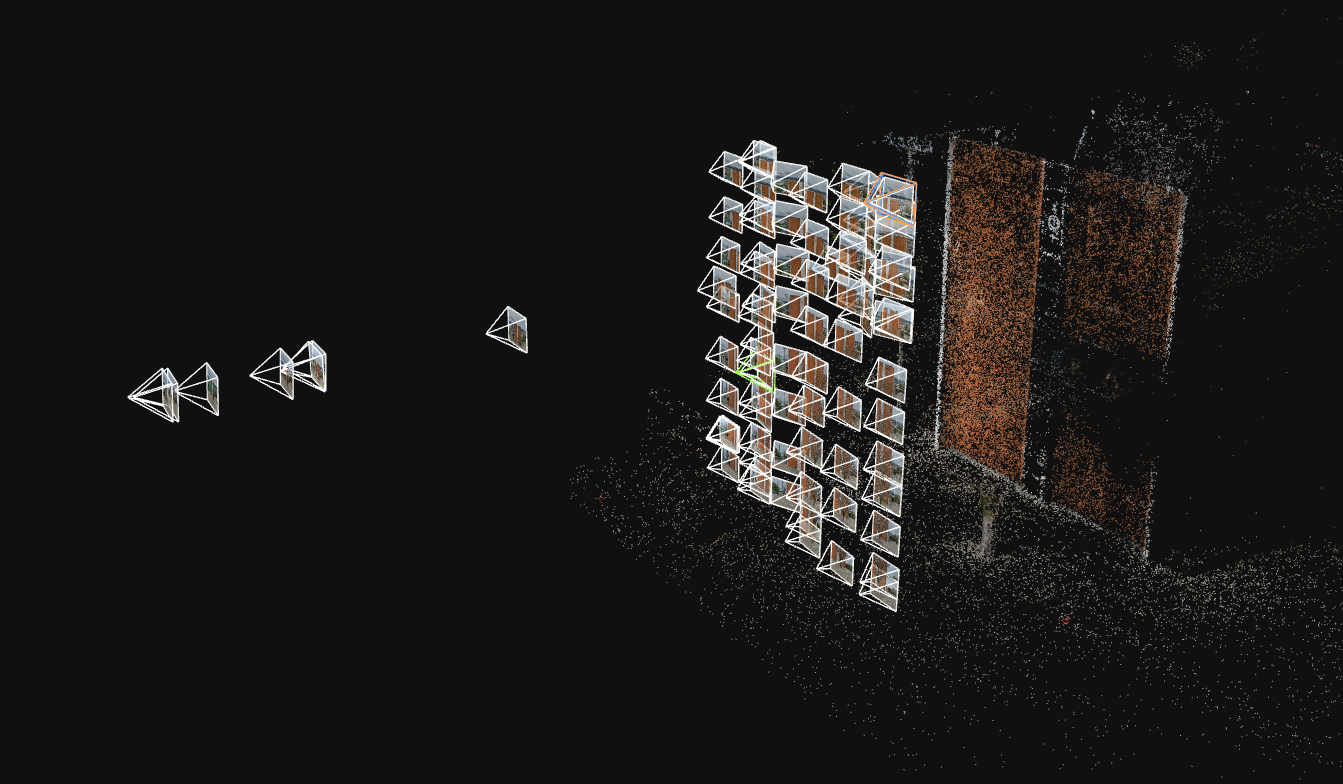
See Shooting tips for details
2. Create a project
When you launch CRITIR, the project list screen appears.
2-1. Create a new project
Click "+ New Project" in the top right.
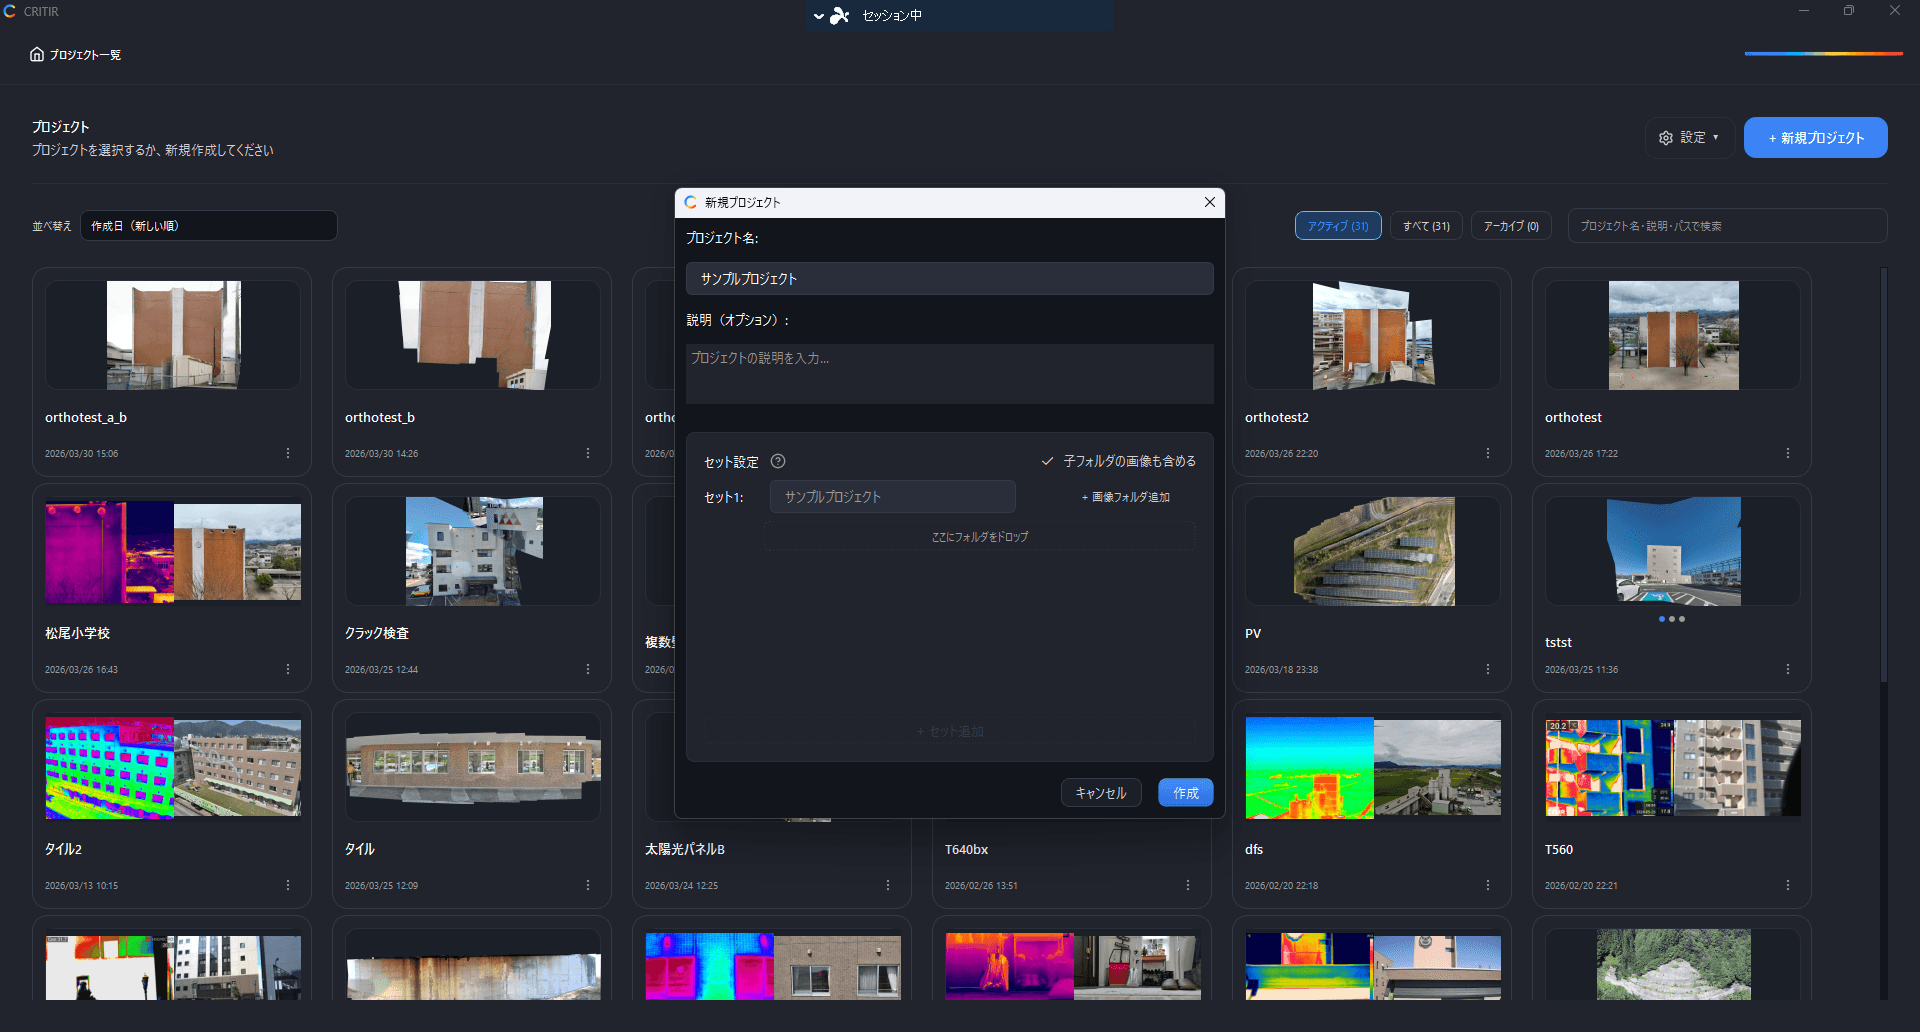
- Project name — enter an easily recognizable name, such as the building or site name
- Description — optional; useful for notes
2-2. Configure sets and image folders
A set is a unit for grouping images. Orthomosaics are generated per set, so the usual approach is to create one set per building face (north face, south face, and so on).
- Enter a set name (e.g.
North face) - Use "+ Add Image Folder" to select the folder containing the captured images
For infrared and visible images to be paired, both images must be in the same folder. Point CRITIR at the captured data with its folder structure unchanged.
If the building has multiple faces, click "+ Add Set" to add as many sets as you need.
2-3. Finish creating the project
Click "Create". The images are scanned automatically and the main screen opens. The paired images appear in the image list on the left side of the screen.
Image scanning and pairing run automatically. If infrared and visible images are not matched correctly, check Supported cameras.
See Project management for details
3. Generate an orthomosaic
An orthomosaic is a single, front-facing image composited from multiple shots. Generating one not only gives you an overview of the entire wall surface — it also links the positions of the individual images, so measurement results are shared across images and onto the orthomosaic.
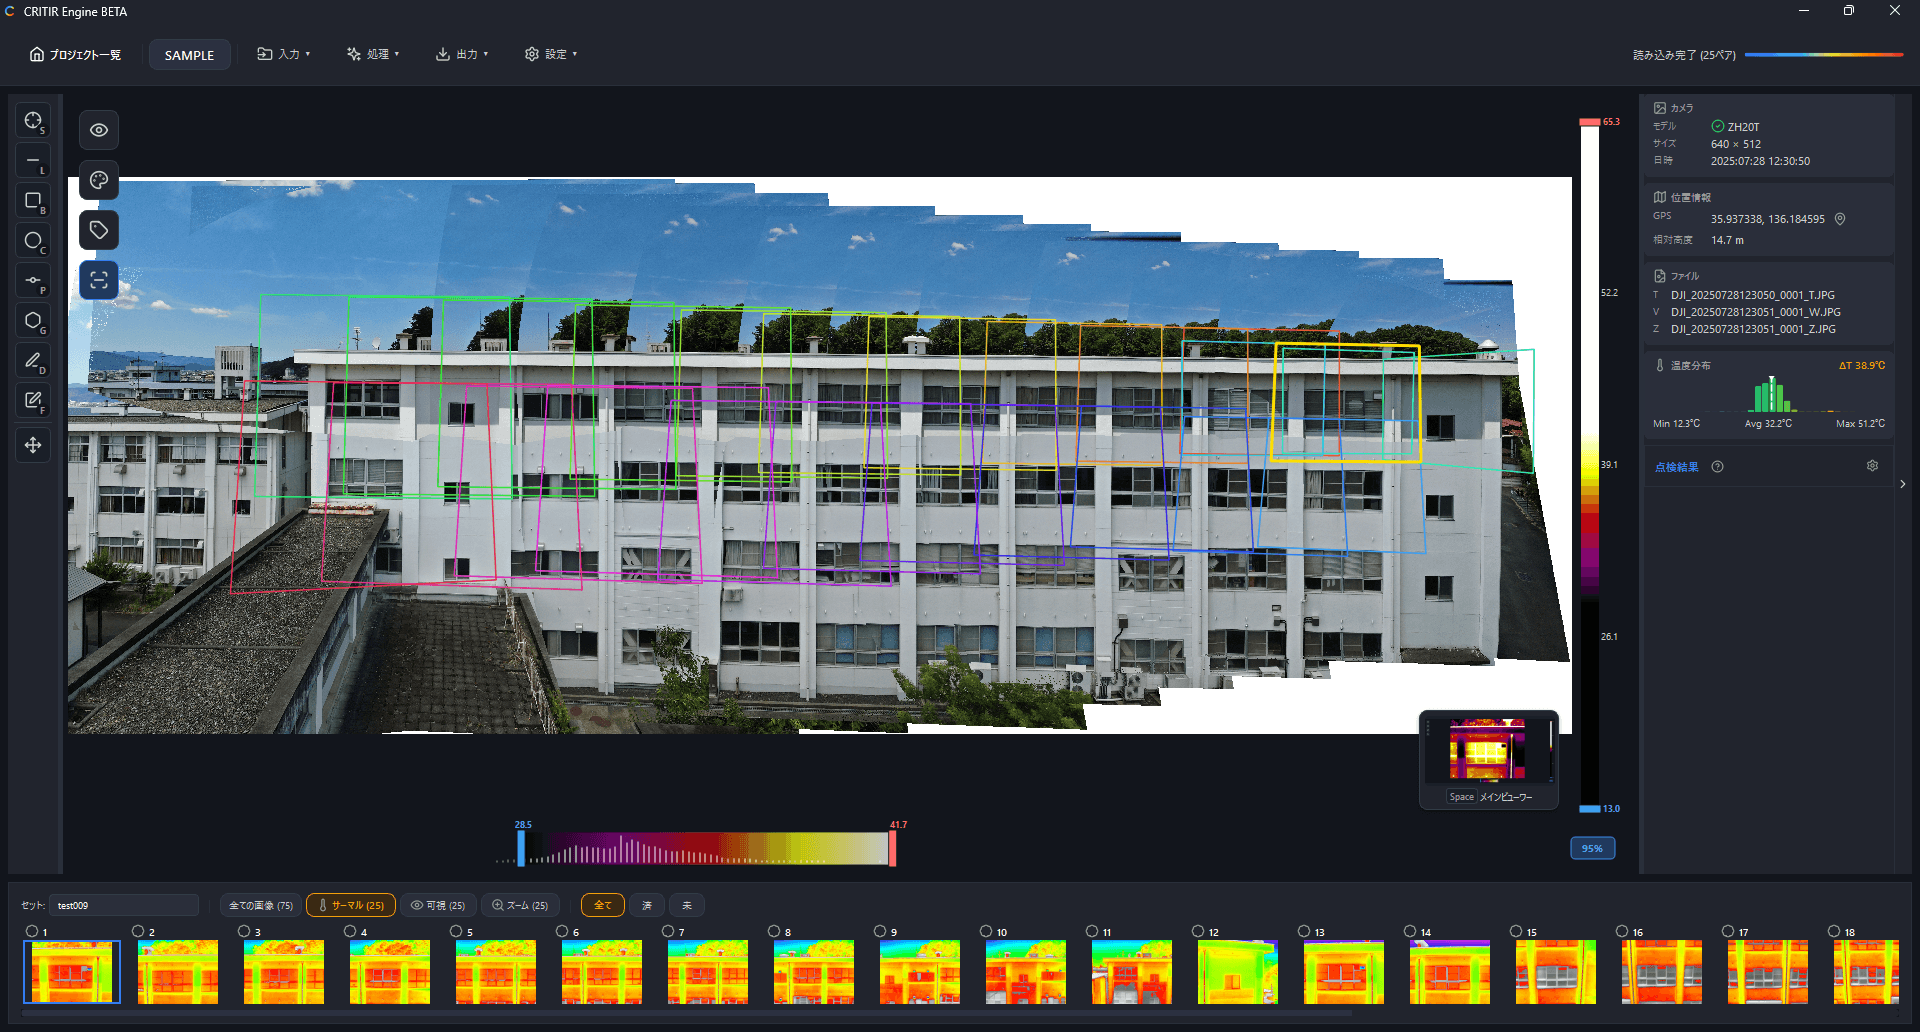
3-1. Launch the wizard
Launch the wizard in either of the following ways.
- Toolbar Process menu → Image Linking / Orthomosaic Generation
- The orthomosaic generation button at the bottom right of the main viewer (shown while no orthomosaic exists)
3-2. Output settings
The default settings are recommended in most cases.
See Output settings for details
3-3. Set selection
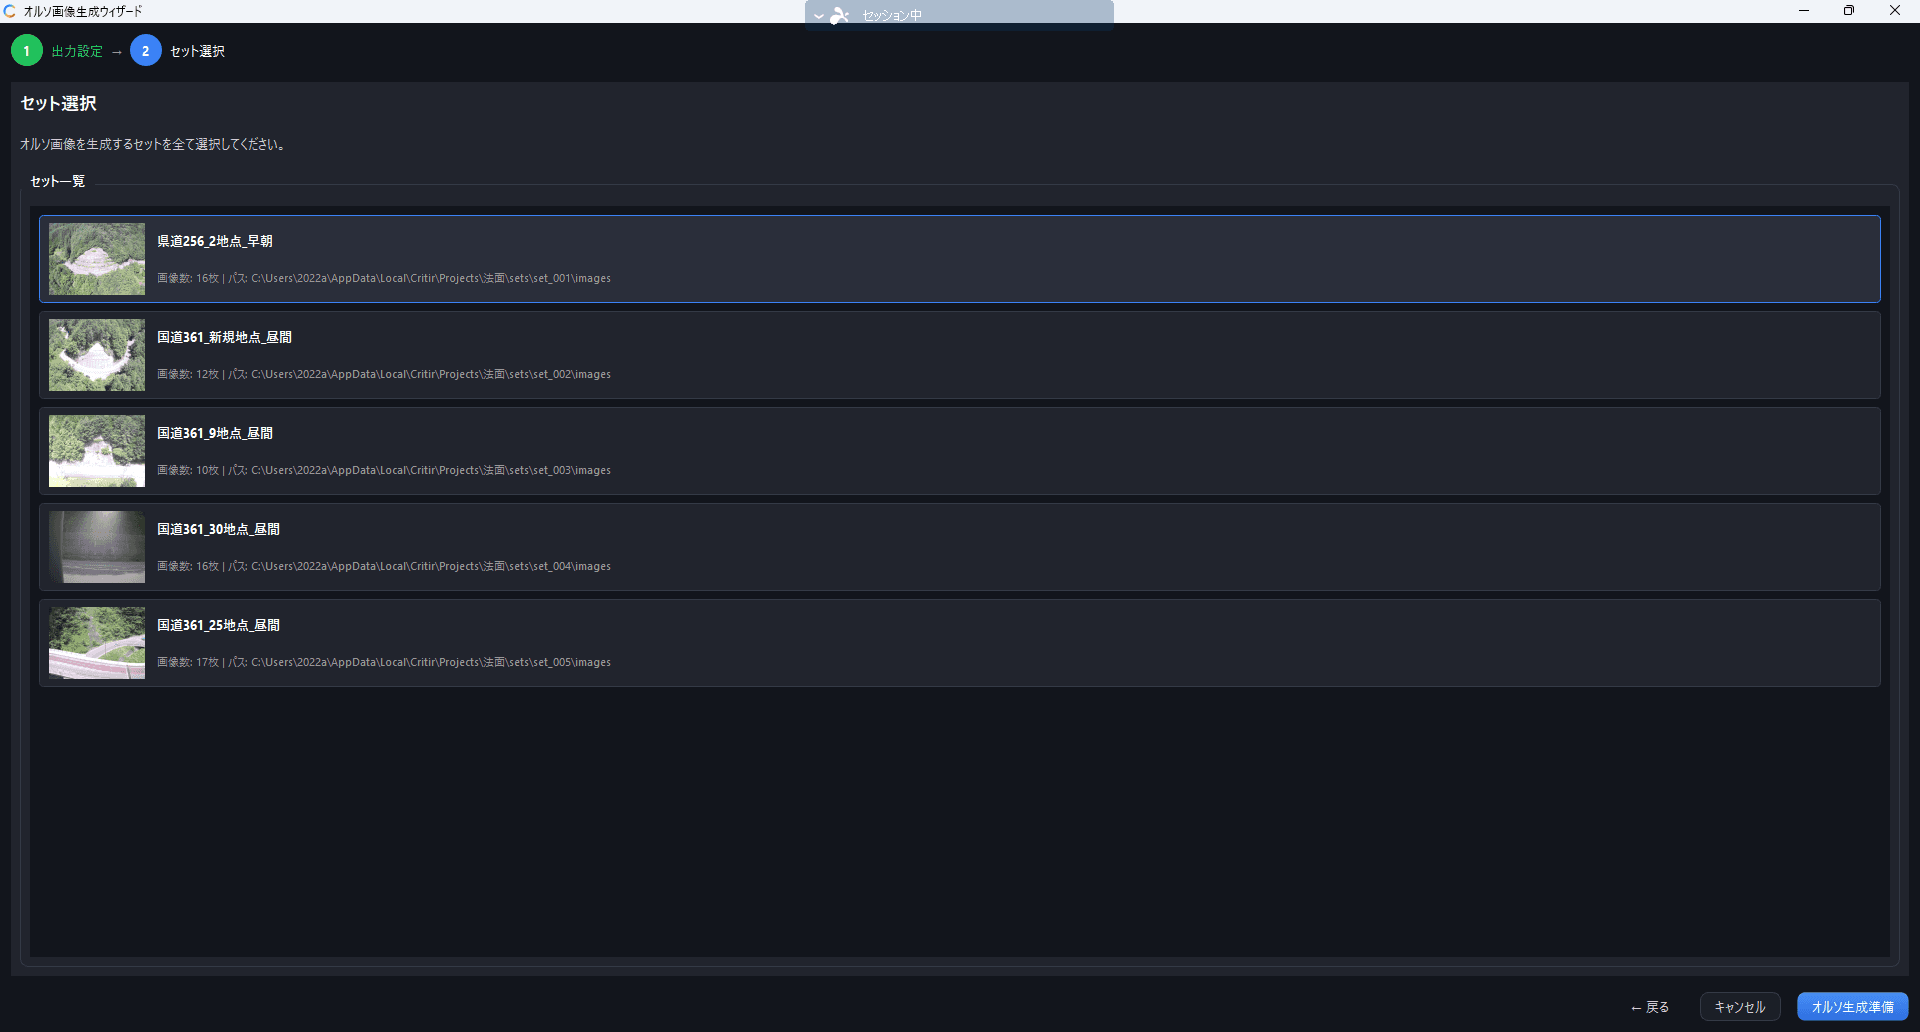
Select the sets to generate orthomosaics for. This step is skipped if the project has only one set.
Image linking can take anywhere from a few minutes to several tens of minutes depending on the number of images and your PC's specs. You can keep using the app while it runs.
3-4. Select the target plane
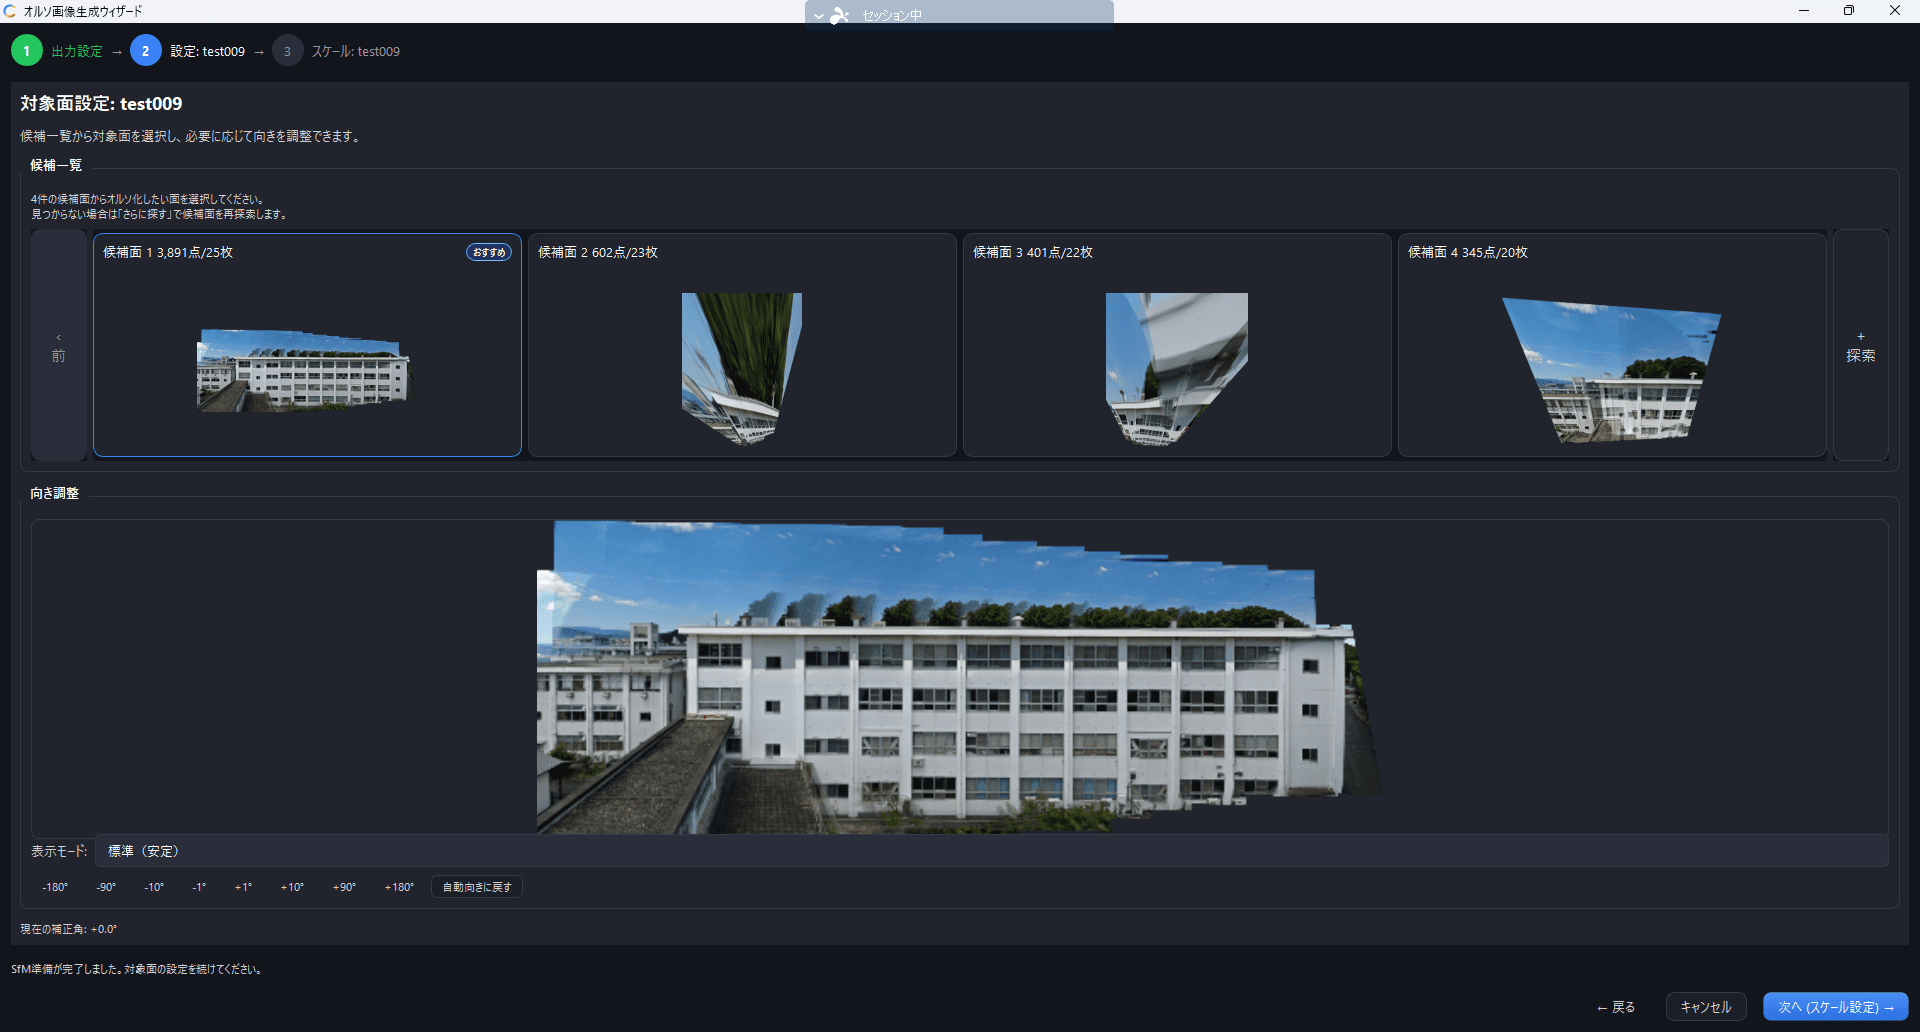
Candidate planes automatically detected from the SfM results are displayed. Select the target wall surface. The candidate with the "Recommended" badge is usually the best choice.
If needed, fine-tune the orientation with the rotation buttons.
3-5. Scale setup (optional)
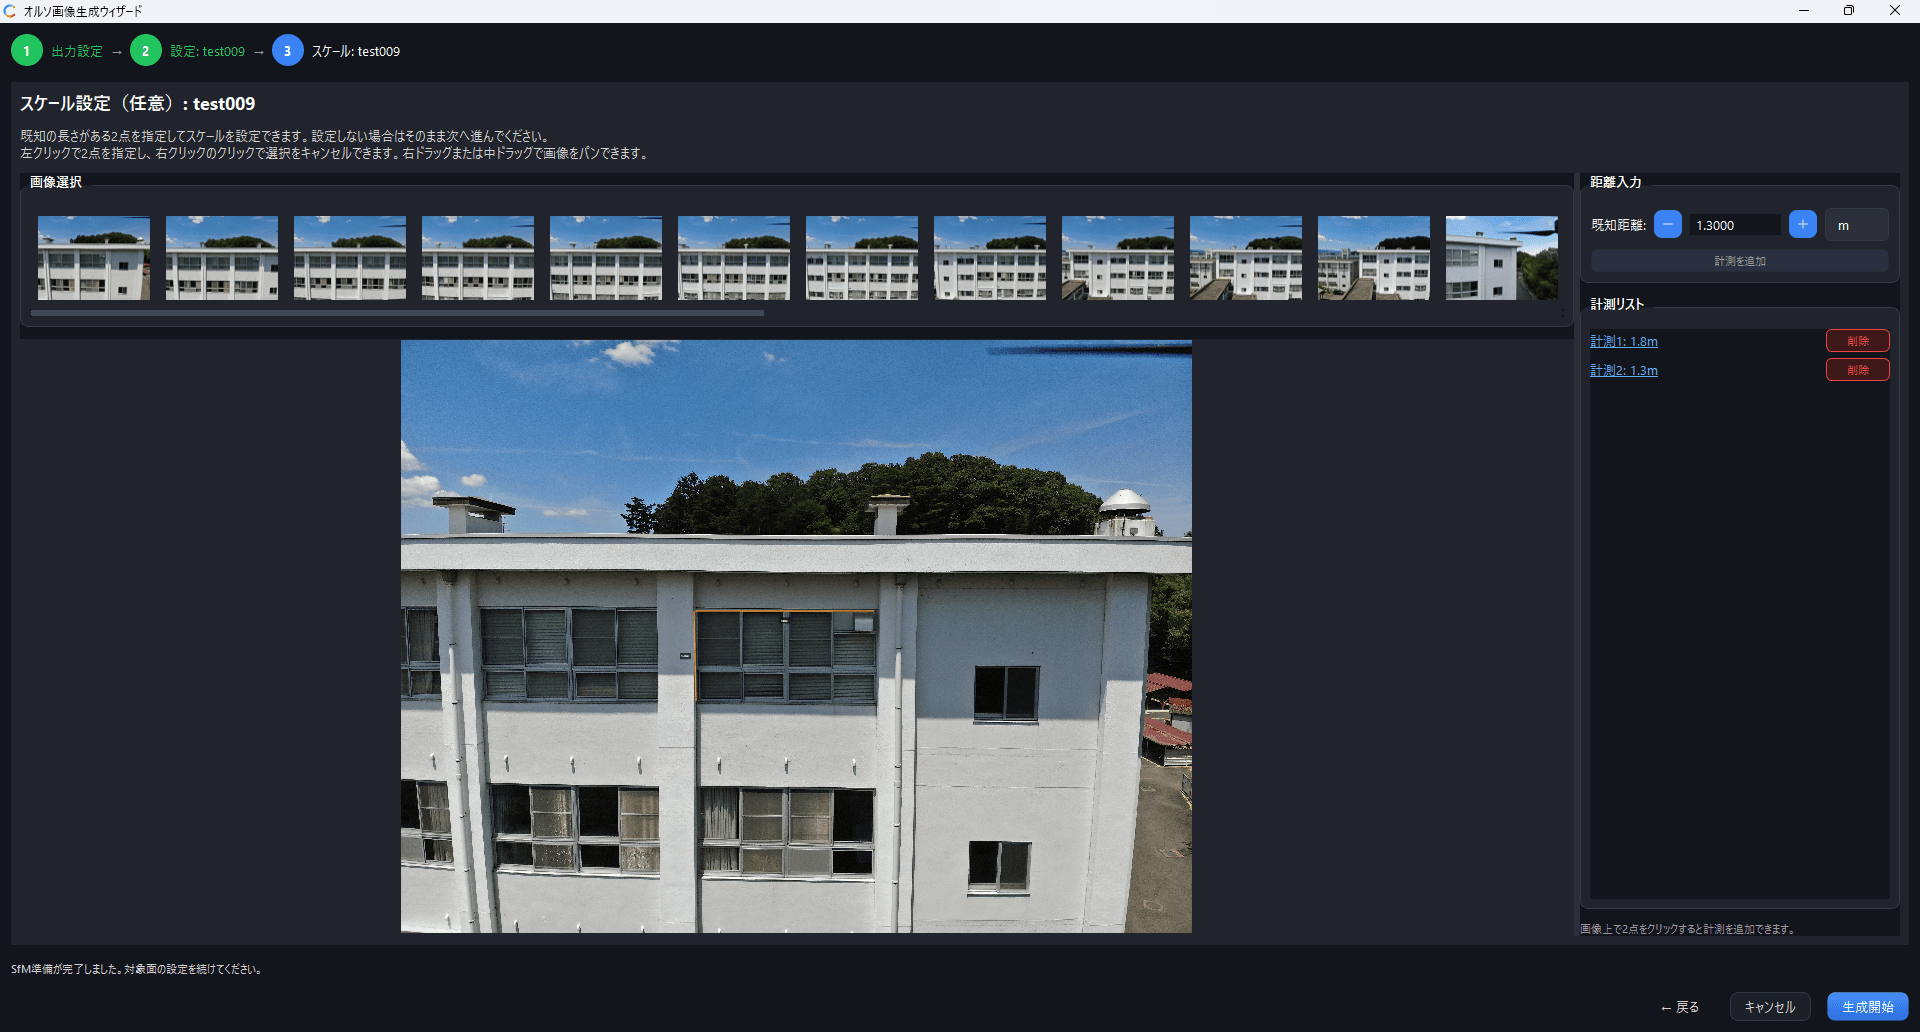
You can calibrate the real-world scale of the orthomosaic by marking two points with a known distance between them. This step can be skipped.
See Orthomosaic generation for details
4. Overlay a blueprint
Once the orthomosaic has been generated, you can load a blueprint and overlay it on the ortho. This is also used when creating deterioration maps for reports.
4-1. Load a blueprint
Go to Input → Add Blueprint File to load a blueprint (DXF / PDF / JPG, etc.) and align it with the orthomosaic. Click four points that mark the same locations, in order, on both the orthomosaic and the blueprint.
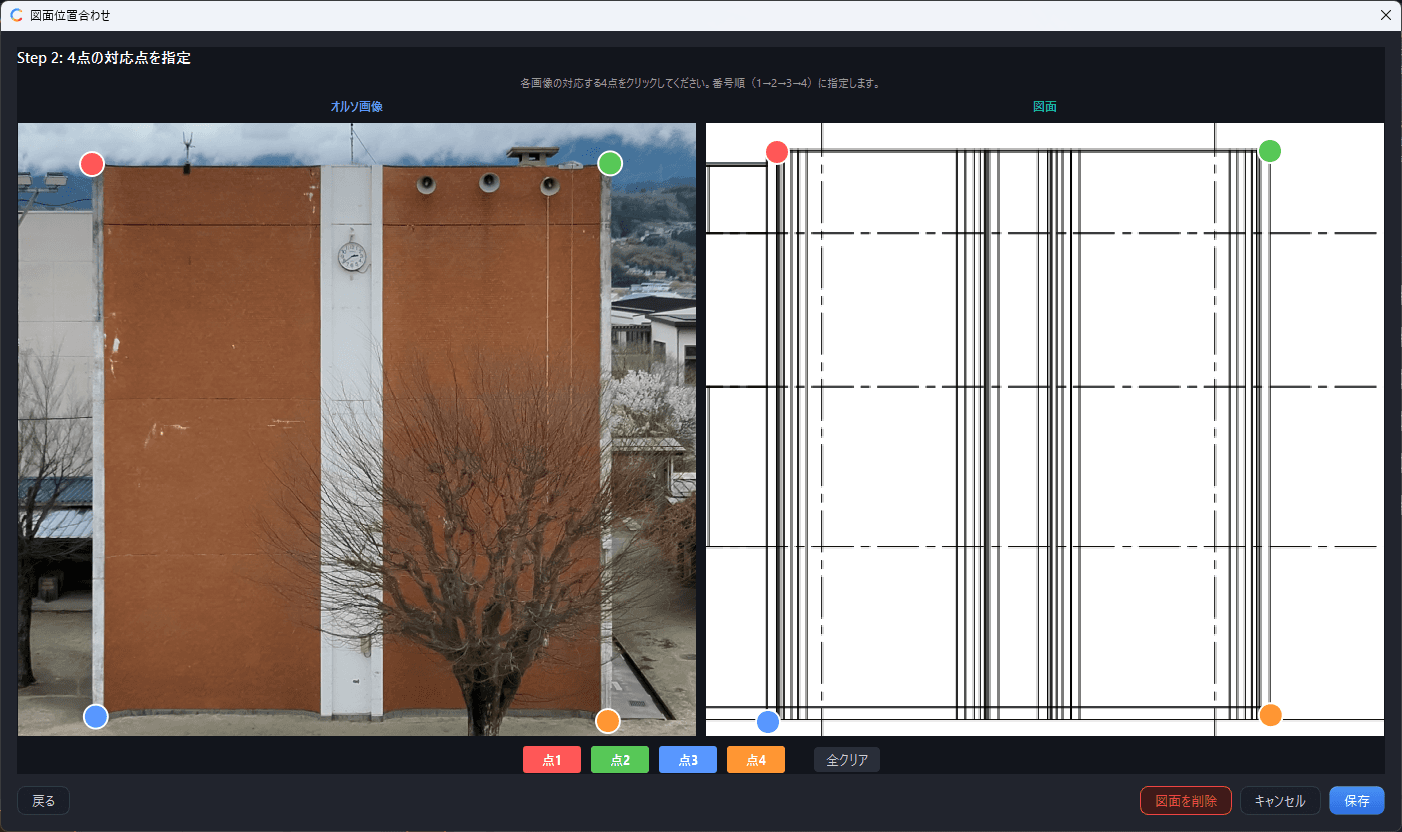
See Loading and aligning a blueprint for details
Loading a blueprint is optional. If you have no blueprint, skip this step and move on to analysis.
5. Analyze and record
Analyze the images and record your findings using the tools below.
5-1. Switch between images
Click an image in the image list at the bottom of the screen, or use the ← → keys to switch images. Press SPACE to jump between the ortho viewer and the main viewer.
5-2. Switch display modes
Use the display mode button on the toolbar, or press 1–8 on the keyboard, to switch display modes.
| Key | Mode | Purpose |
|---|---|---|
| 1 | Infrared | Check the temperature distribution |
| 2 | Visible image | Check the visual appearance |
| 3 | Zoomed image | Magnified view of part of the visible image |
| 4 | Side-by-side view | Compare infrared and visible images next to each other |
| 5 | Swipe | Reveal infrared or visible with a draggable handle |
| 6 | Picture-in-Picture | Overlay a small infrared window on the visible image |
| 7 | Overlay | Blend the infrared image translucently over the visible image |
| 8 | Compare mode | Compare infrared-to-infrared or visible-to-visible across different images |
5-3. Adjust the temperature display range
Use the temperature slider at the bottom of the screen to adjust contrast.
- Drag the blue handle (low end) and red handle (high end)
- Drag between the handles to slide the whole range
- Double-click to cycle through percentile presets (95% / 98% / 100%)
- Right-click → Lock to fix the temperature span
5-4. Measure anomalies
Select a measurement tool from the toolbar or switch tools with the shortcut keys.
| Key | Tool | Operation | Measured values |
|---|---|---|---|
| S | Spot | Click a single point on the image | Temperature at that point |
| L | Line | Click two points | Temperature profile along the line, max / min / average temperature, distance |
| B | Box | Drag to draw a rectangle | Max, min, average, median, standard deviation, area |
| C | Circle | Click the center → drag to set the radius | Max, min, average, median, standard deviation, area |
| P | Polyline | Click multiple points → right-click to finish | Temperature profile along the polyline, max / min / average temperature, distance |
| G | Polygon | Click multiple points → right-click to finish | Max, min, average, median, standard deviation, area |
| D | Pen - Line | Drag to draw freehand | Temperature profile along the line, max / min / average temperature, distance |
| F | Pen - Polygon | Drag to draw a freehand region | Max, min, average, median, standard deviation, area |
Measurement results are listed in the results panel on the right side of the screen. For each measurement you can set a judgment (Normal, Needs Review, Needs Correction, etc.) and a type (tile delamination, water leak, etc.).
Measurements created on one image are automatically projected onto other images showing the same location, as well as onto the orthomosaic.
See Viewer basics, Thermal image analysis, and Measurement tools for details
6. Export a report
Once measurement and judgment are complete, export the inspection report.
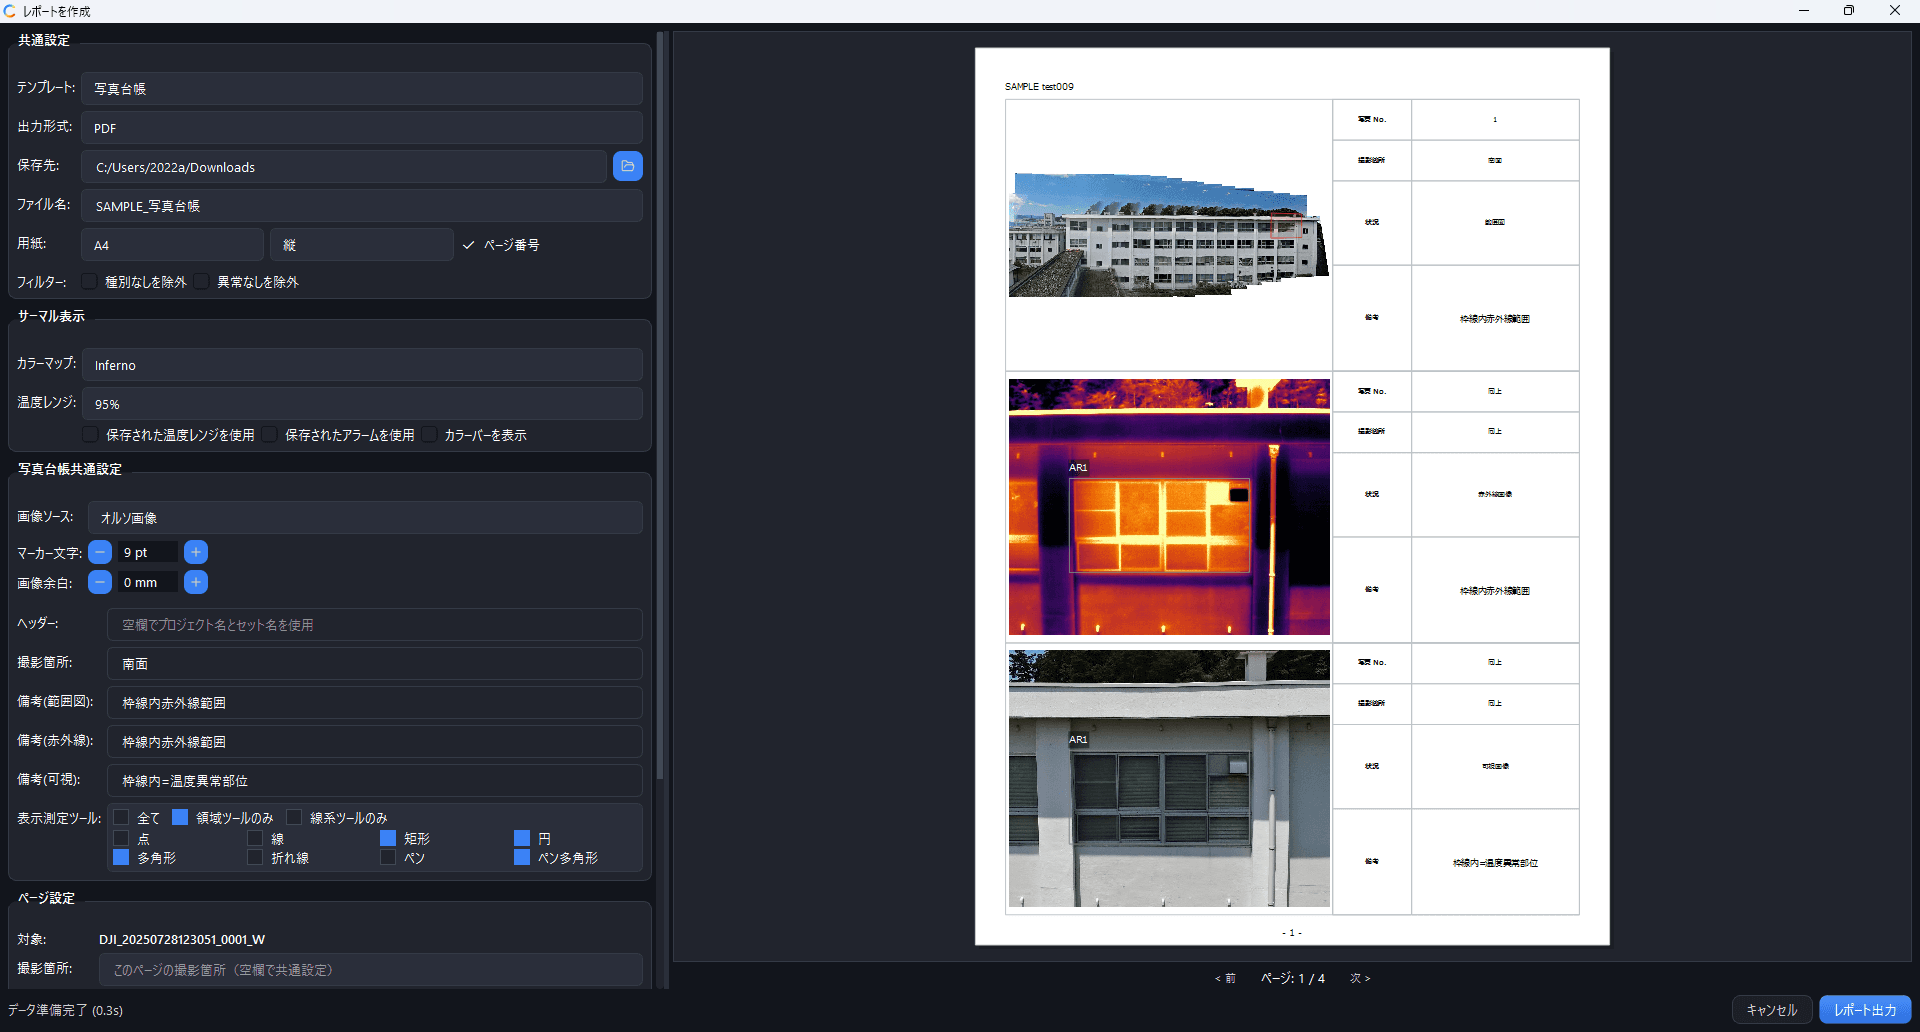
6-1. Open the report creation screen
Select Export menu → Create Report on the toolbar.
6-2. Choose a template
| Template | Contents |
|---|---|
| Standard | A formal survey report with cover page, overview, detail sheets, and summary tables |
| Photo ledger | Infrared and visible images organized by shooting location |
| Deterioration map | Deterioration locations mapped onto the orthomosaic or a blueprint |
| Quantity table | Deterioration quantities totaled by type |
6-3. Check the preview and export
Check the result in the real-time preview in the right panel, and click "Export" when you are satisfied.
See Report creation and Export for details
Next steps
Once you have the basic workflow down, the following guides help you get more out of each feature.