
Measurement tools
Using the eight temperature measurement tools and managing results
Selecting a tool
Select a measurement tool from the toolbar on the left side of the screen, or switch with keyboard shortcuts. Click the active tool again to deselect it.
Measurement tools
| Icon | Tool | Key | Operation | Measured values |
|---|---|---|---|---|
| Spot | S | Click a point on the image | Temperature at that point | |
| Line | L | Click two points | Temperature profile along the line, max/min/average temperature, distance | |
| Box | B | Drag to draw a rectangle | Max, min, average, median, standard deviation, area | |
| Circle | C | Click the center, then drag to set the radius | Max, min, average, median, standard deviation, area | |
| Polyline | P | Click multiple points, double-click to finish | Temperature profile along the polyline, max/min/average temperature, distance | |
| Polygon | G | Click multiple points, double-click to finish | Max, min, average, median, standard deviation, area | |
| Pen - Line | D | Drag to draw freely | Temperature profile along the line, max/min/average temperature, distance | |
| Pen - Polygon | F | Drag to draw a region freely | Max, min, average, median, standard deviation, area |
Area tools (Box / Circle / Polygon / Pen - Polygon) also generate a temperature histogram (distribution chart).
Drawing helpers
| Action | Description |
|---|---|
| Alt (held) | Constrains drawing. Line tools snap to horizontal/vertical; Box/Circle become a square/perfect circle |
| Ctrl + Z / Backspace | While drawing a polyline/polygon, remove the last vertex |
| Enter | Finish drawing a polyline/polygon |
| Esc | Discard the measurement being drawn (the tool stays selected) |
Measurement projection
Measurements created on one image are automatically projected onto other images showing the same spot and onto the orthomosaic.
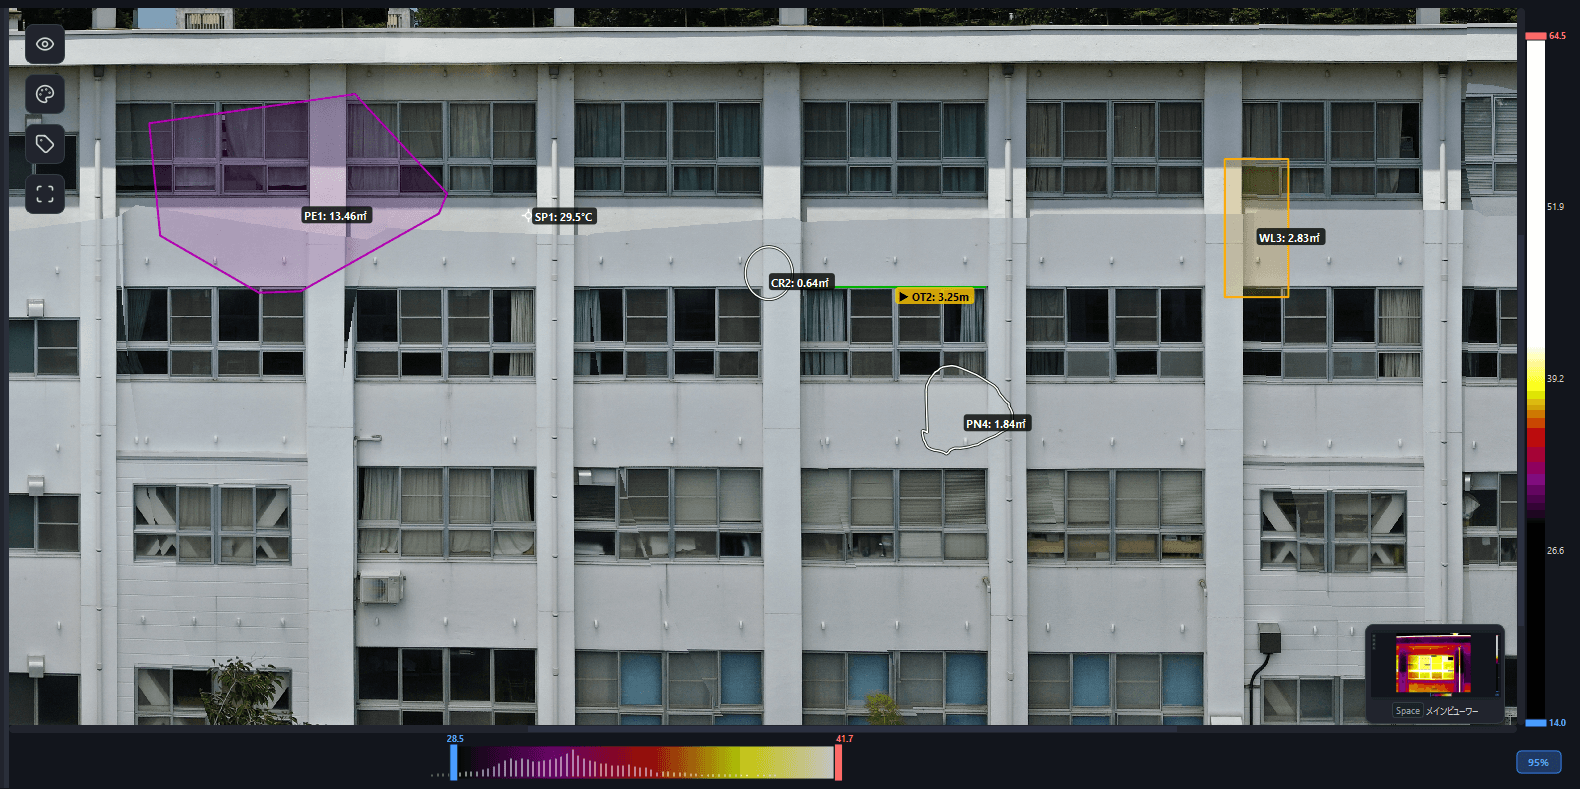
Projection accuracy depends on the accuracy of the SfM reconstruction. With insufficient capture angles or image overlap, projected positions may be offset.
To find the images that show a spot without creating a measurement, use same-location search.
Label settings
Open the label panel from on the toolbar to configure how measurement labels are displayed.
| Setting | Description |
|---|---|
| Name + Measurement | Show both the name and the measured value on the label (default) |
| Name Only | Show only the name on the label |
| Hidden | Hide labels |
| Size | Adjust the label font size (5–20) |
| Display Only on Measurement Image | Show only measurements created on the current image and hide projections from other images |
| Display in cm / cm² | Switch distance/area units from m / m² to cm / cm² |
Measurement presets
The Measurement Preset panel on the right side of the screen lets you decide what is filled in automatically for the measurements you are about to create. On sites where the same type and judgment repeat, you no longer have to pick them for every measurement.
| Item | Description |
|---|---|
| Thickness | Line width for new measurements (1.0–10.0 px, default 2.0 px). restores the default |
| Type | Default type applied to new measurements. Edit the options from the Type Settings button |
| Judgment | Default judgment applied to new measurements. Edit the options from the Judgment Settings button |
| Part | Default part applied to new measurements. Edit the options from the Part Settings button |
| Unit | Default unit given to quantities of area-based tools |
| Findings | Findings text inserted into new measurements |
Findings presets
Frequently used findings text can be registered as a preset.
- Type text into the findings field and press + to add the current text as a preset
- Choosing a preset from the combo box inserts that text into the findings field
- Press − to delete the selected preset
- Clear empties the findings field
These are initial values for new measurements. Existing measurements are unaffected — change those individually from the results panel.
Managing measurement results
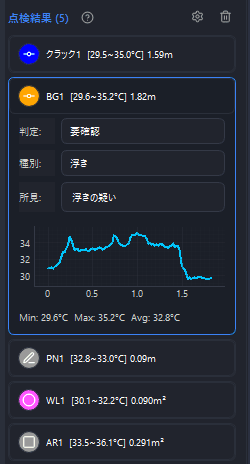
Results panel
All measurement results are listed in the results panel on the right side of the screen.
Judgment and findings
Click a measurement to open its edit panel, where you can set the type (delamination / crack / water leak, etc.), judgment (Normal / Needs Review / Needs Correction / Other), part (wall / column / beam / floor / ceiling), quantity and unit, and findings (free text). These entries are reflected in reports.
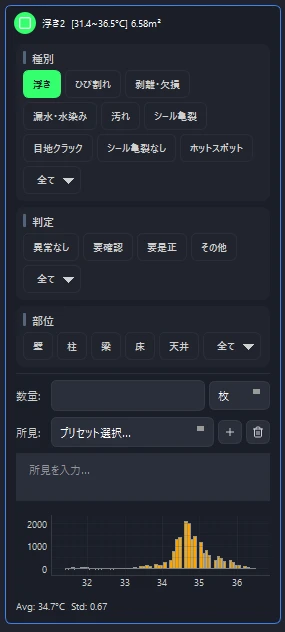
For area tools, the bottom of the panel also shows a temperature histogram with the average temperature and standard deviation.
Type/judgment settings
The button on the results panel opens the settings for types and judgments (colors, ID names, custom types, custom judgments).
Color, line style, and fill pattern per type
In type settings, you can assign a drawing style to each type. By styling delamination, cracks, water leaks, and so on differently, the kind of deterioration is recognizable at a glance.
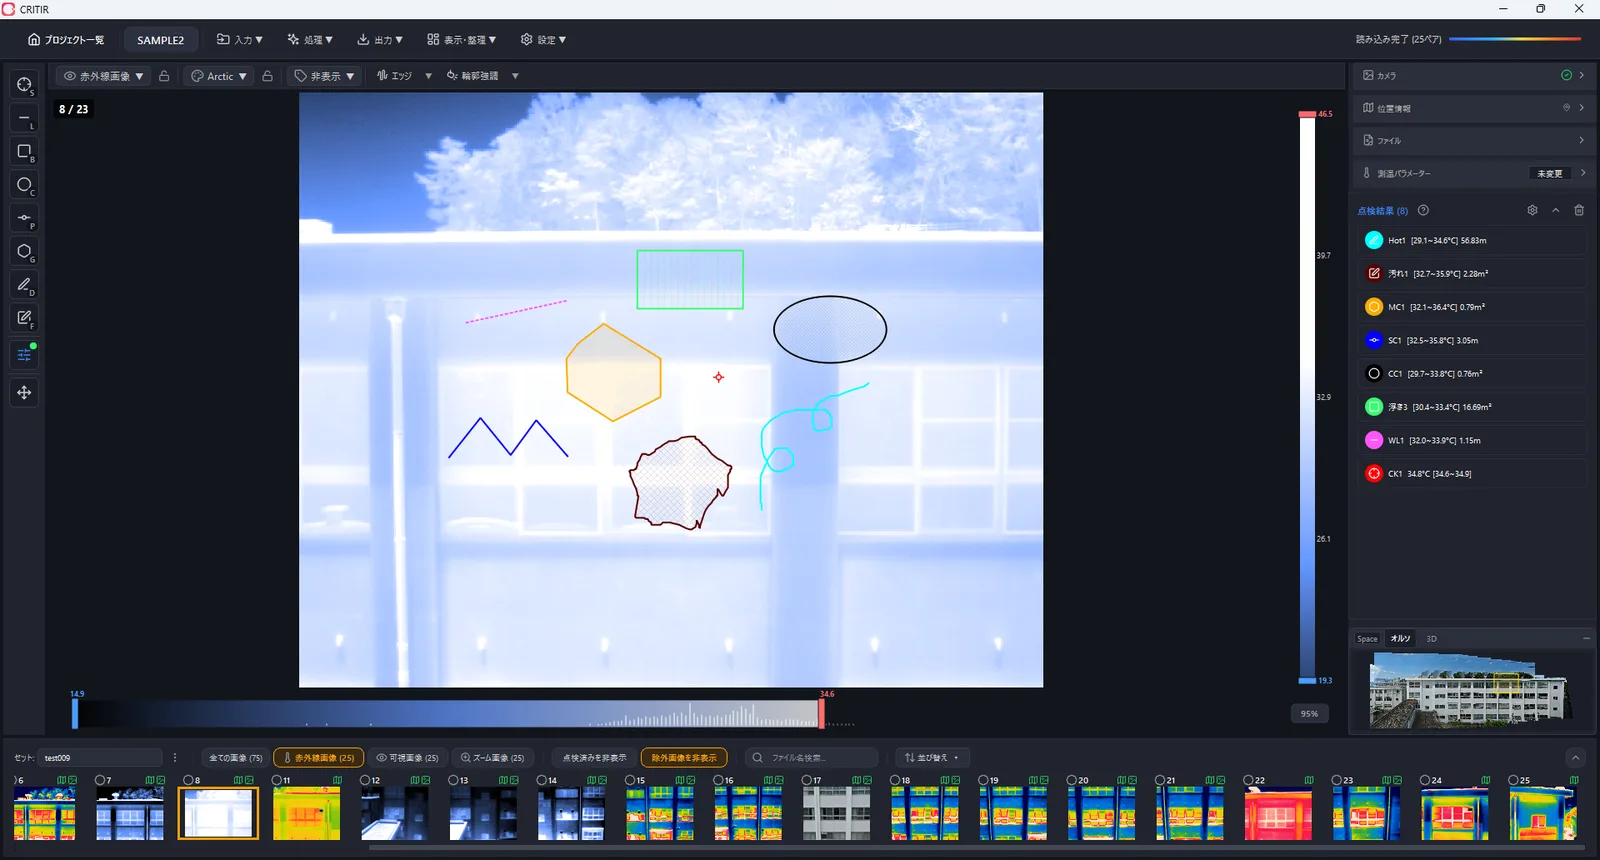
| Setting | Options |
|---|---|
| Color | Any color per type |
| Line style | Solid / Dashed / Dotted / Dash-dot |
| Fill pattern | Solid / Diagonal / Diagonal (dense) / Diagonal cross / Diagonal cross (dense) / Grid / Grid (dense) / Vertical / Vertical (dense) / None |
| Prefix | ID name used in labels (e.g. CK → CK1, CK2...) |
Styles are configured per type. All measurements of the same type are drawn with the same color, line style, and fill pattern, and this also carries over to the deterioration map CAD (DXF) export.
Quantity units
Measurements made with area tools (Box / Circle / Polygon / Pen - Polygon) and line tools (Line / Polyline / Pen - Line) can carry a quantity and a unit (Spot is excluded). Choose a default unit under Unit in the Measurement Preset panel and it is applied automatically to new measurements. Available units are sheets / locations / lengths / items / faces / m / m², and each measurement's unit can also be changed individually.
Deleting measurements
- Click the × button on the results panel
- Select a measurement and press the Delete key
- Or right-click a measurement and choose "Delete"
The button on the results panel deletes all inspection results (for the image or the set).
Inspection workspace
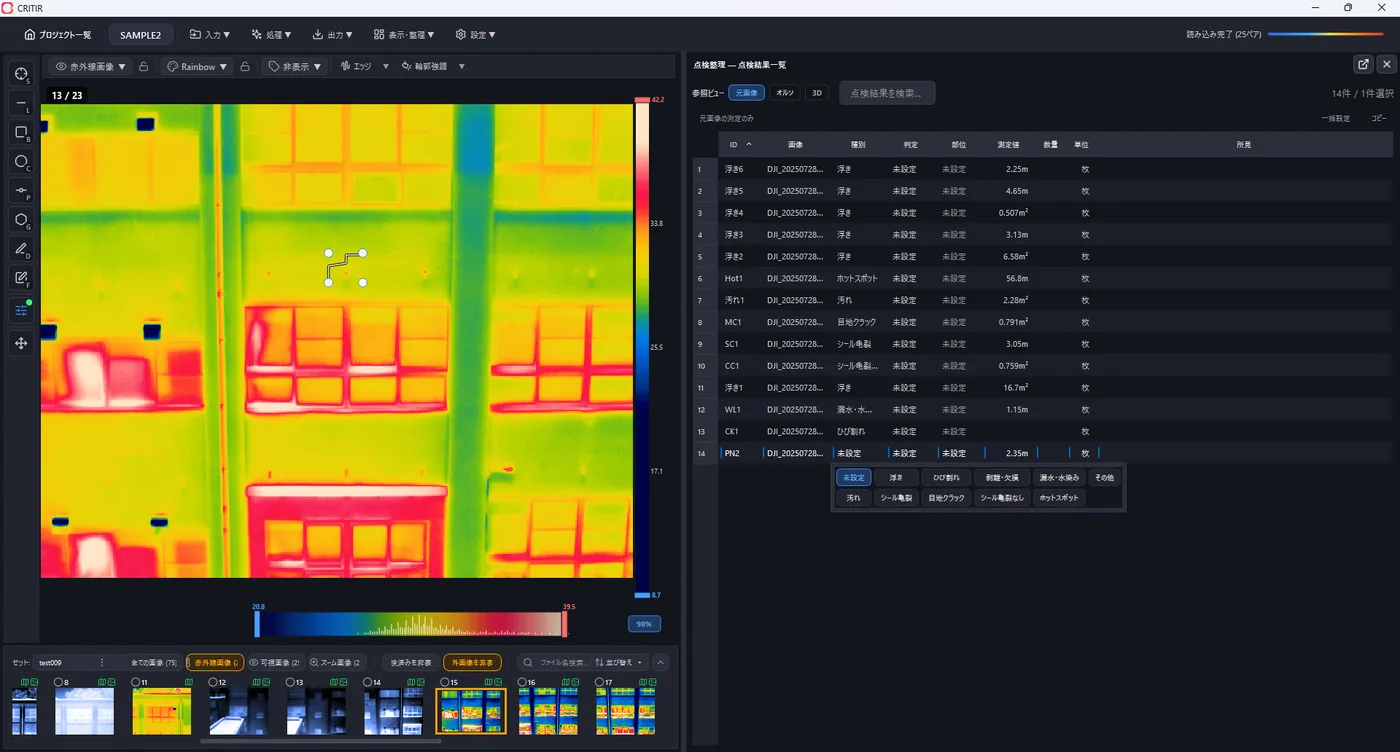
Turn on View & organize ▾ → Inspection workspace on the toolbar to see every measurement in the project in a table. This is handy for entering judgments and findings in bulk.
Reading the table
The table shows nine columns: ID / Image / Type / Judgment / Part / Measurement / Quantity / Unit / Findings, sorted with the newest measurements at the top.
The Type, Judgment, Part, Quantity, Unit, and Findings cells can be edited in place (ID, Image, and Measurement are read-only). Selecting a row moves the viewer to the corresponding measurement.
Filtering and bulk operations
| Action | Description |
|---|---|
| Reference view | Switch between source image / ortho / 3D to choose which view to reference while organizing |
| Search inspection results… | Filter by keyword across all columns |
| Current source image only | Show only measurements created on the currently displayed source image |
| Bulk edit | Set Type, Judgment, Part, and Unit for multiple selected rows at once |
| Copy | Copy selected rows as tab-separated text with headers (Ctrl + C), ready to paste into Excel |
The panel can be dragged out into a separate window. When detached, the Return to main window button puts it back.
The choices for Type, Judgment, and Part can be added or changed on the corresponding tabs under Settings ▾ → Common Settings....