
Infrared image analysis
Adjusting thermal parameters and the temperature range, choosing color palettes, and setting alarms
Thermal parameters
The temperatures recorded by an infrared camera are computed under assumptions such as emissivity and reflected temperature. If the settings used during capture did not match the target, you can change them afterwards in CRITIR and have the temperatures recalculated.
Edit them under Thermal Parameters in the right panel. The panel appears while a FLIR or DJI thermal image is displayed.
| Item | Description | Default |
|---|---|---|
| Emissivity | Emissivity of the target. Roughly 0.90–0.95 for concrete and tile | 0.95 |
| Reflected Temperature | Temperature of the surroundings reflected by the target (sky, buildings, …) | 20 °C |
| Distance | Distance from the camera to the target | 1.0 m |
| Atmospheric Temperature | Air temperature during capture | 20 °C |
| Relative Humidity | Humidity during capture | 50 % |
An item marked (Estimated) was not recorded in the image and has been estimated by CRITIR. Enter the real value if you know the actual conditions.
Scope of the setting
The setting is applied together to images of the same camera model within a set. Different sets are configured independently, and different camera models within the same set are kept separate.
The badge at the top right of the panel shows the current state.
| Badge | State |
|---|---|
| Unchanged | Using the values recorded in the image as-is |
| Unsaved | You edited the values but have not saved yet |
| Saved | Your manual values are saved and applied |
Saving and recalculation
Pressing Save recalculates the temperatures of the affected images with the new parameters. Images that already have measurements also get their temperature values recalculated, with progress shown on the toolbar.
Use Image Defaults discards your manual settings and restores the capture-time values recorded in the image.
Thermal parameters cannot be changed for images captured in DJI thermal cameras' High Res mode — they are fixed by the capture settings. Because this format is not officially supported by the DJI SDK, temperatures are shown as reference values from a simplified decoder. Relative temperature differences can still be compared.
For what to configure at capture time, see Shooting tips. Keeping the settings consistent within a survey keeps comparisons in your report consistent too.
Adjusting the displayed temperature range
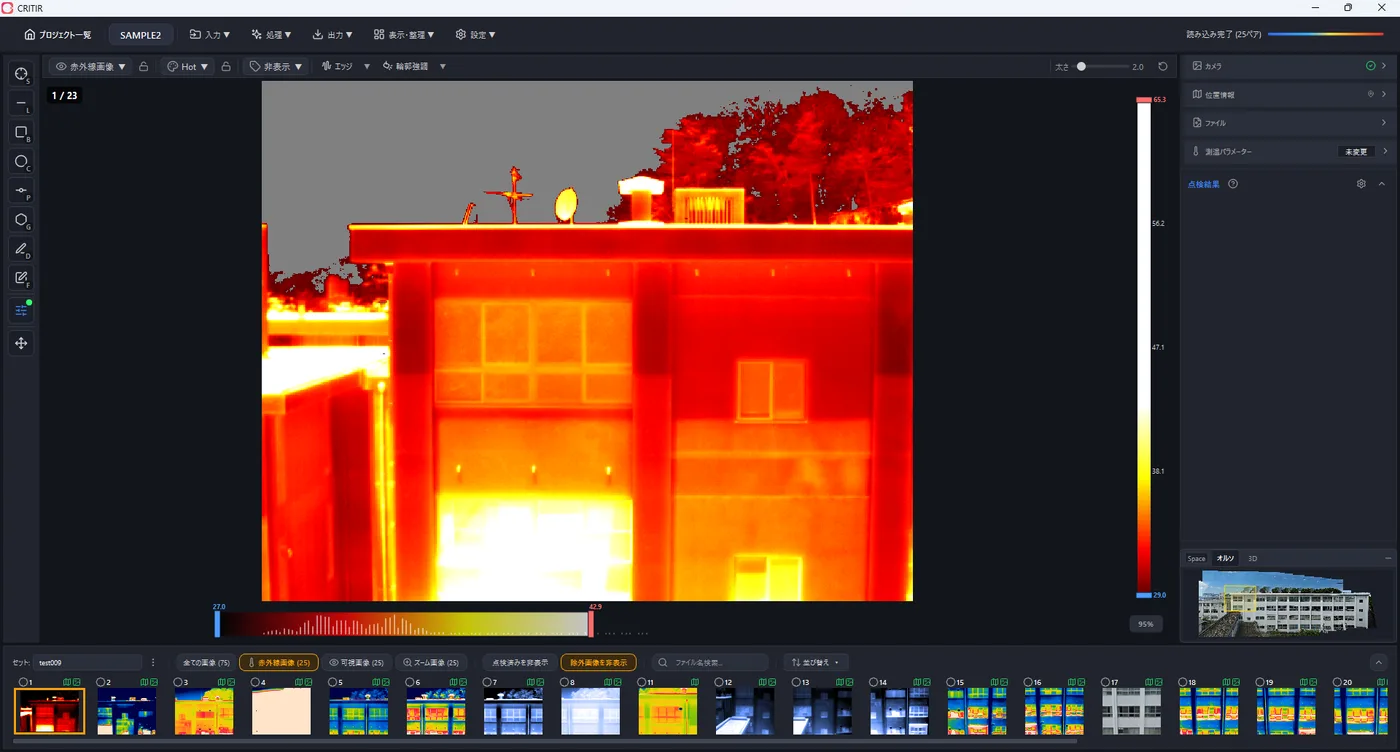
Use the temperature slider at the bottom of the screen to adjust the contrast of the infrared image.
- Drag the blue handle and red handle to set the range
- Drag between the two handles to slide the whole range
- A histogram (temperature distribution) is shown in the background
Quick adjustment with the Shift key
You do not have to reach for the temperature slider — hold Shift and move the mouse over the image to adjust the display range (no clicking required). Dial in the contrast quickly while keeping your eyes on the image.
| Action | Effect |
|---|---|
| Hold Shift and move left/right | Slide the display range |
| Hold Shift and move up/down, or use the mouse wheel | Widen or narrow the temperature span (contrast adjustment, center preserved) |
Release Shift to finish. This works in the main viewer, the ortho viewer, and the 3D view.
Percentile presets
Double-click the temperature slider or click a preset button to jump to a commonly used display range.
| Preset | Description |
|---|---|
| 95% | Standard range excluding outliers. Higher contrast (default) |
| 98% | Slightly wider range. Use when extreme highs and lows should also be visible |
| 100% | Full data range. Lower contrast because outliers are included |
Locking the display range
You can lock the display range from the right-click menu. While locked, the range is preserved when switching images. Unlock by double-clicking or via the right-click menu.
Alarm settings
Use the alarm bar on the right side of the viewer to set temperature alarm thresholds.
- Drag the red handle (upper limit) and blue handle (lower limit) to set the thresholds
- Drag between the two handles to shift both thresholds together
- Pixels inside the threshold range are colored with the palette; pixels outside are shown in gray
- Double-click to reset the alarm thresholds
Locking the thresholds
You can lock the thresholds from the right-click menu. While locked, the thresholds are preserved when switching images. Unlock by double-clicking or via the right-click menu.
The temperature slider state and alarm settings are saved automatically.
Temperature mask
Masks pixels outside a specified temperature range and excludes them from statistics. You get accurate maximum, minimum, and average temperatures that are not skewed by sky or background in the frame.
How to configure
Open the settings from either of the following:
- The button to the right of Infrared Image in the display mode bar (tooltip: Temperature Mask Settings)
- Settings ▾ → Common Settings... → Temperature Mask tab on the toolbar
| Item | Description | Default |
|---|---|---|
| Enable Temperature Mask | Turns the mask on or off | Off |
| Lower Limit | Masks temperatures below this value (-100.0 to 100.0 °C) | -20.0 °C |
| Upper Limit | Masks temperatures above this value (100.0 to 3000.0 °C) | 1600.0 °C |
| Display masked areas using the visible image | When on, masked areas show the visible image; when off, they are shown in gray | Off |
Preset buttons apply representative values quickly.
| Preset | Lower / Upper |
|---|---|
| Default | -20.0 °C / 1600.0 °C |
| Strict | -10.0 °C / 500.0 °C |
| Lenient | -40.0 °C / 2000.0 °C |
Where it applies
The settings apply to both the main viewer and the ortho viewer, and measurement statistics are recalculated. They are also reflected in report output and image export. The settings are saved with the project and restored the next time it is opened.
The operating range of the temperature slider (display range) is not affected by the temperature mask. Even with a mask configured, you can adjust contrast across the image's full temperature range.
Color palettes
Choose how infrared images are colored from 10 palettes.
Standard palettes
| Palette | Characteristics | Recommended use |
|---|---|---|
Ironbow | Expresses temperature differences with both brightness and hue | General purpose. The most widely used standard palette |
Rainbow | Wide gamut that color-codes temperature bands | Overview of temperature distribution |
Rainbow HC | High-contrast variant of Rainbow with more colors | Detecting subtle temperature differences, detailed analysis |
Scientific palettes
| Palette | Characteristics | Recommended use |
|---|---|---|
Inferno | Perceptually uniform color transitions; color-vision friendly | Quantitative analysis, reports |
Hot | Intuitive representation of "heat" | Locating heat sources, finding insulation defects |
Lava | Warm palette with rich gradation in dark areas | Analyzing hot spots, visualizing temperature gradients |
Coolwarm | Symmetric scheme with white at mid-range temperatures | Deviation from a reference temperature, hot/cold comparison |
Arctic | Cool-toned palette with a chilly look | Low-temperature analysis, condensation and air-leak surveys |
Monochrome palettes
| Palette | Characteristics | Recommended use |
|---|---|---|
White Hot | Cold is black, hot is white | Traditional display mode |
Black Hot | Inverted grayscale — hotter is darker | Traditional display mode |
Edge display
Open the edge panel from on the toolbar. Two features are available: temperature edges and contour enhancement.
Temperature edges
Visualizes the boundaries of temperature changes, making areas with steep temperature gradients easy to spot.
| Setting | Description |
|---|---|
| Source | Extract edges from the display (image after colormap) or from temperature (temperature data) |
| Reference Image | Choose the infrared or visible image as the reference |
| Sensitivity | Edge detection sensitivity (0–100) |
| Opacity | Opacity of the background image while edges are shown (0–100%) |
Contour enhancement
Overlays contour lines from the visible image onto the infrared image, so building structure and component boundaries are visible on the infrared image.
| Setting | Description |
|---|---|
| Sensitivity | Contour detection sensitivity (0–100) |
| Edge Color | White or black |