
Creating reports
Configuring inspection reports and exporting to PDF and Word
Opening the report screen
Select Export menu → Create Report on the toolbar.
A template selection screen appears first. Once you choose a template, the report creation screen opens.
The report creation screen is split into two panels: settings on the left, and a real-time preview on the right.
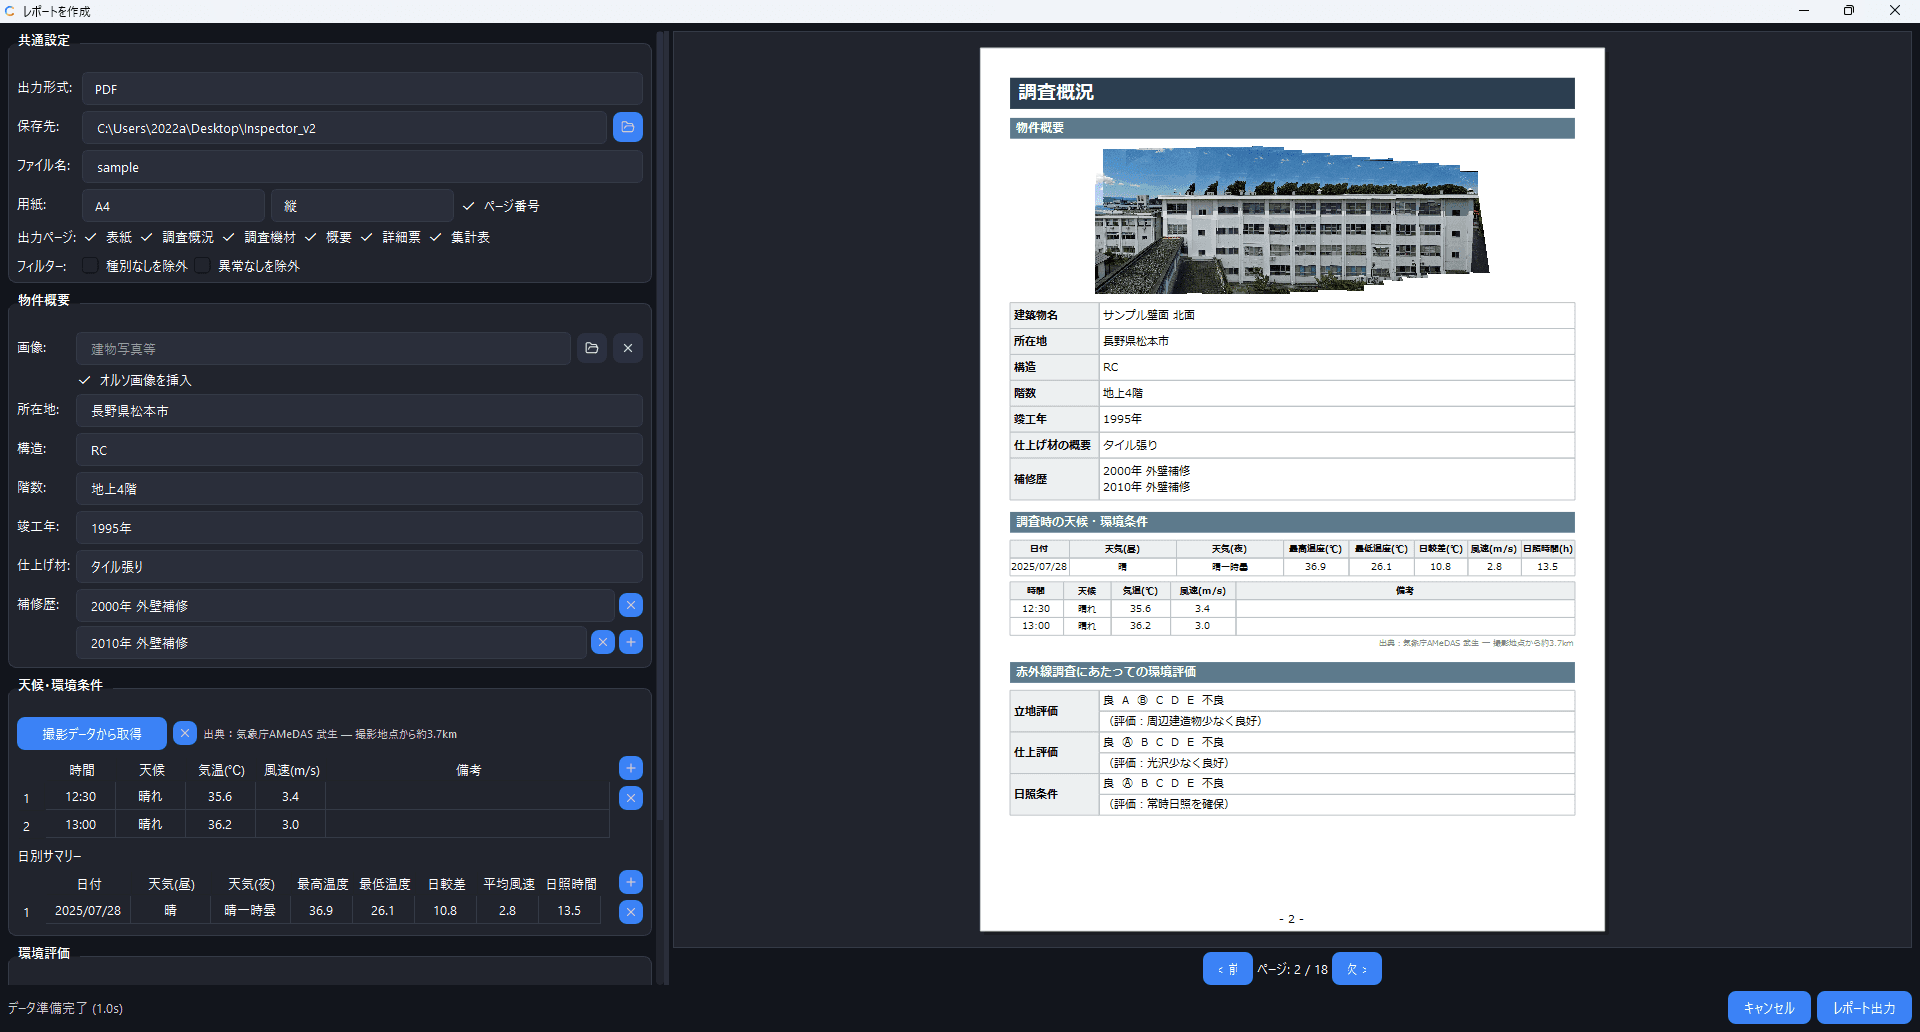
The preview may differ slightly from the actual output. Always verify the final exported file.
Template selection
When creating a report, choose a template that matches your purpose.
| Template | Description | Use case |
|---|---|---|
| Standard | Standard inspection report format with cover, summary, detail sheets, and summary table | Formal inspection reports |
| Photo ledger | Photo ledger format organizing a coverage map, infrared image, and visible image per shooting location | Visual documentation of shooting locations |
| Deterioration map | Deterioration map format showing deteriorated areas on a drawing. Supports DXF export | Drawing-based display of deteriorated areas (requires an orthomosaic and an imported drawing) |
| Quantity table | Quantity table format aggregating deterioration quantities by type. Supports Excel export | Aggregation and estimation of deterioration quantities |
Templates are displayed as cards; click one to select it. The template you selected last time is preselected by default.
You can also switch templates from the template dropdown inside the report creation screen.
In addition to the built-in templates above, the Custom category lets you select your own templates. Reports with custom layouts can be built with the template builder.
Common settings
| Item | Description |
|---|---|
| Output format | PDF or Word |
| Save to | Directory where the output file is saved |
| File name | Name of the output file (the extension is added automatically) |
| Paper | A4 / A3 / Letter, portrait / landscape |
| Page number | Whether to show page numbers in the footer |
| Output pages | Toggle each page of the report on or off individually |
| Filter | Exclude items with no type / Exclude normal items |
| Font | Default font for the entire report (see below) |
| Measurement line width | Adjust the thickness of measurement frames, lines, and circles with a slider (standard = 100%) |
Font
The Font dropdown on the report output screen selects the default font for the entire report. Both Japanese and Latin fonts are available.
| Font | Notes |
|---|---|
| Meiryo | Default |
| Yu Gothic / MS Gothic / BIZ UDGothic | Gothic (sans-serif) family |
| Yu Mincho / MS Mincho / BIZ UDMincho | Mincho (serif) family |
| Arial (Latin) / Times New Roman (Latin) | Latin fonts |
Fine-grained formatting such as italic, underline, and text color is configured per block in the template builder (the report output screen only selects the font). In the template builder, you can set "Font", "Bold", "Italic", "Underline", and "Text color" individually for each text/table block; setting the font to "(Follow output settings)" inherits the report-wide default font.
Thermal display settings
Display settings applied to infrared images. They are shared across all templates.
| Item | Description |
|---|---|
| Color map | Color palette for infrared images |
| Temperature range | Percentile (95% / 98% / 100%) |
| Use saved temperature range | Apply the per-image display range set during inspection |
| Use saved alarms | Apply the per-image alarm thresholds set during inspection |
| Show Color Bar | Show a temperature scale on infrared images |
| Color bar placement | Outside image (to the right) / Overlay on image. Available when the color bar is enabled |
Measurement data
The measurement data contained in the previewed page is listed here. You can edit the judgment, type, and findings of each measurement directly on the report screen. Changes are saved to the project.
Standard template
The standard inspection report format. It consists of the following six page types, each of which can be toggled on or off individually in the output page settings.
| Page | Contents |
|---|---|
| Cover | Title, property name, survey date, client, company information, and logo |
| Inspection Summary | Property overview, weather data, and environment assessment |
| Inspection Equipment | Camera model, resolution, features, chief surveyor, and qualifications |
| Overview | List of measurement markers on the orthomosaic or drawing |
| Detail Sheet | Visible image, infrared image, and temperature data for each measured location |
| Summary Table | Count aggregation by type (delamination / crack, etc.) with a location map |
Cover
| Item | Description |
|---|---|
| Client | Company and contact name the report is addressed to |
| Honorific | 御中 / 様 / 殿 / None (Japanese honorifics) |
| Title | Report title (default: Exterior Wall Infrared Inspection Report) |
| Property name | Name of the inspected building |
| Survey date | Today's date is filled in automatically; freely editable |
| Cover image | Image such as a building photo. An orthomosaic can also be inserted |
| Company logo | Logo image shown on the cover |
| Company name | Company name shown on the cover |
The honorifics are intended for reports addressed to Japanese recipients: 御中 for an organization, 様 for an individual, and 殿 for formal or official correspondence. Choose None when a Japanese honorific is not required.
Surveyor
| Item | Description |
|---|---|
| Show company logo | Include the logo in the surveyor section |
| Postal code / address | Company location |
| TEL / FAX / email | Contact information |
| Chief surveyor | Name of the chief surveyor |
| Qualifications | Certifications (multiple entries, comma-separated) |
| Survey Scope | Description of the survey |
Surveyor information (company name, contact details, qualifications, etc.) is saved as a global setting and carried over automatically to future projects.
Property overview
| Item | Description |
|---|---|
| Image | Building photo shown on the property overview page. An orthomosaic can also be inserted |
| Location | Building address |
| Structure | Building structure (e.g., reinforced concrete) |
| Floors | Number of floors (e.g., 5 above ground / 1 below) |
| Year Completed | Year the building was completed |
| Finish material | Exterior wall finish (e.g., tiled) |
| Repair History | Past repair records (multiple rows can be added) |
Weather and environmental conditions
Weather information can be retrieved automatically from the capture data. Click the Retrieve from Capture Data button to fetch data from the nearest AMeDAS weather station based on the capture date, time, and location.
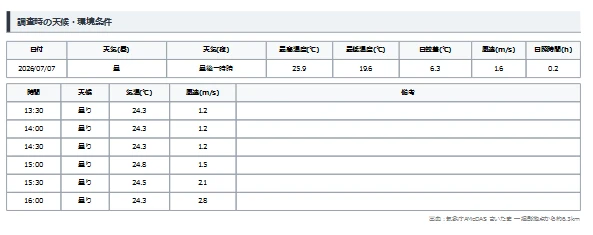
"Retrieve from Capture Data" requires an internet connection. In offline environments, enter the data manually.
Retrieved data:
- Time-series data: Weather, temperature, and wind speed by time slot
- Daily summary: Per-day weather, high/low temperatures, diurnal range, average wind speed, and sunshine duration
The data can also be edited manually, and rows can be added or removed.
Environment assessment
The building's surroundings are rated on a five-grade scale from A (good) to E (poor).
| Assessment item | What is assessed |
|---|---|
| Site assessment | Influence of surrounding structures on infrared radiation detection |
| Finish assessment | Influence of the exterior wall finish on infrared radiation detection |
| Sunlight condition | Availability of sunlight |
A comment (reason for the rating) can be entered for each item.
Inspection equipment overview
| Item | Description |
|---|---|
| Device Name | Camera model name (auto-detected from EXIF) |
| Resolution (visible) | Resolution of the visible images (auto-detected) |
| Resolution (infrared) | Resolution of the infrared images (auto-detected) |
| Features | Camera features and capabilities (free text) |
| Camera image | Photo of the camera |
If a project contains images from multiple camera models, the inspection equipment section shows a separate entry for each model.
Camera information is auto-detected from image EXIF data. Once edited, the content is saved per camera model and applied automatically in future projects that use the same model.
Overview page
| Item | Description |
|---|---|
| Image Source | None / Orthomosaic / Blueprint |
Detail sheet
| Item | Description |
|---|---|
| Image Source | Hidden / Orthomosaic / Blueprint / 3D |
| 3D View | Shown when the image source is "3D". Fit Whole / Frontal / Frontal Fit (default) |
| Layout | Auto / Top (Wide) / Left (Tall) / Stacked Vertically |
| Marker Text | Font size of marker labels (6–32 pt) |
The 3D image source can be used as a capture-location map when a 3D model has been generated. It cannot be selected without a 3D model. See 3D model for details.
Summary table
| Item | Description |
|---|---|
| Image Source | None / Orthomosaic / Blueprint |
| Marker Text | Font size of marker labels (6–32 pt) |
Photo ledger template
A photo ledger report that organizes a coverage map, infrared image, and visible image for each shooting location. Only images that contain measurement data are included in the output.
Page layout
Each page corresponds to one shooting location and uses a three-row, two-column layout.
| Row | Left column (image) | Right column (notes) |
|---|---|---|
| Row 1 | Coverage map (capture position on the orthomosaic) | Notes |
| Row 2 | Infrared image (with measurement markers) | Notes |
| Row 3 | Visible image (with measurement markers) | Notes |
A header (project name) and the shooting location name are shown at the top of each page.
Common settings
| Item | Description |
|---|---|
| Header | Project name shown at the top of each page. By default, generated from the project name and set name |
| Location (default) | Default shooting location name for each page. If not set, the image file name is used |
| Notes (range map) | Text shown in the notes field for the coverage map (shared by all pages) |
| Notes (infrared) | Text shown in the notes field for the infrared image (shared by all pages) |
| Notes (visible) | Text shown in the notes field for the visible image (shared by all pages) |
Measurement types to display
You can filter which measurement tool types are shown on the visible image.
| Type | Description |
|---|---|
| Spot | Point temperature measurement |
| Line | Line temperature measurement |
| Area | Rectangular temperature measurement |
| Circle | Circular temperature measurement |
| Polygon | Polygonal temperature measurement |
| Polyline | Polyline temperature measurement |
| Pen | Freehand temperature measurement |
| Pen Polygon | Freehand closed-region temperature measurement |
Measurement markers of unchecked types are not shown on the visible image.
Per-page settings
You can override settings individually for the page currently shown in the preview.
| Item | Description |
|---|---|
| Location | Shooting location name for the current page (takes precedence over the common setting) |
| Notes (range map) | Coverage map notes for the current page (takes precedence over the common setting) |
| Notes (infrared) | Infrared notes for the current page (takes precedence over the common setting) |
| Notes (visible) | Visible-image notes for the current page (takes precedence over the common setting) |
Per-page settings follow the preview's page navigation: the page currently shown in the preview is the one being edited.
Deterioration map template
A deterioration map report that displays markers for deteriorated areas on a drawing. Requires an orthomosaic and an imported drawing (DXF).
| Item | Description |
|---|---|
| Image Source | Orthomosaic / Blueprint |
| Marker Text | Font size of marker labels (6–32 pt) |
| Displayed measurement tools | Filter which measurement tool types are shown on the deterioration map |
Output formats
In addition to PDF and Word, export to DXF format is also supported.
Quantity table template
A quantity table report that aggregates deterioration quantities by type. Measurement data can be aggregated across all sets.
| Item | Description |
|---|---|
| Title | Title of the quantity table (default: Deterioration Quantity Summary Table) |
| Property name | Building name (defaults to the project name) |
| Drawing name | A drawing name can be set per set |
Output formats
In addition to PDF and Word, export to Excel format (.xlsx) is also supported.
Custom template
Selecting a custom template built in the template builder reveals the Custom Template group.
| Item | Description |
|---|---|
| Marker Text | Font size of marker labels drawn on images (6–32 pt) |
| Show Labels | Whether marker labels are drawn on the images |
| Measurement zoom | Zoom factor for the "zoomed to measurements" image types: 1.5× / 2× / 3× / 4× / 6× / 8× / Auto (fit to measurements) |
Measurement zoom crops 1/n of the original image centred on the measurements. Auto enlarges to the size of the measurements, up to the equivalent of 8×. When measurements are spread widely, the factor is automatically reduced so that everything fits.
Image order
The order in which images appear in the report can be changed with the Sort ▾ button in the header of the image list panel. The order you set here is reflected in the report.
| Menu item | Description |
|---|---|
| Reorder manually... | Open a dialog for free reordering by drag & drop |
| Capture time | Sort by capture date and time |
| Align along wall | Auto-arrange along the wall surface based on image linking / orthomosaic generation results (submenu below) |
| Reset to filename order (default) | Reset to the default filename order |
Submenu of "Align along wall":
| Item | Order |
|---|---|
| Rows first (left to right, top to bottom) | Left to right, row by row |
| Rows, serpentine (alternate direction each row) | Alternating direction on each row |
| Columns first (top to bottom, left to right) | Top to bottom, column by column |
| Columns, serpentine (alternate direction each column) | Alternating direction on each column |
"Align along wall" depends on image linking / orthomosaic generation results and is not available before generation.
Preview
The right panel shows a real-time preview of the report.
- Use the arrow buttons at the bottom of the page to move between pages
- The current page number and total page count are displayed
- Setting changes are reflected in the preview automatically
Export
When your settings are complete, click the Export button at the bottom of the screen. A progress bar is shown during export; when it finishes, you can open the file or show it in its folder.