
Why thermal cameras can find delaminated facade tiles, and why the pattern flips at night
How infrared surveys detect debonded (delaminated) facade tiles, explained with diagrams and real thermal images. Why a delaminated area looks warmer by day and cooler after sunset, the conditions that hide the contrast (overcast skies, north faces, shade, wind), the usual causes of false positives (reflections, color, materials, equipment heat) and how to rule them out, and how infrared relates to hammer tapping.
Key points
- An infrared camera sees temperature differences, not tiles. The air gap behind a delaminated tile blocks heat flow, so only that area drifts in surface temperature
- Warm by day, cool after sunset. The pattern flips because the heat flow reverses, and around the changeover the contrast vanishes
- The contrast is smaller than you think. On test panels at Japan's Building Research Institute, a 1.0 mm gap gave roughly 0.4–0.5 °C. Overcast skies, north faces, shade and wind shrink it further
- A warm patch is not automatically delamination. Rule out reflections, color, material, equipment heat and shadow edges against the visible image, then confirm what remains by tapping
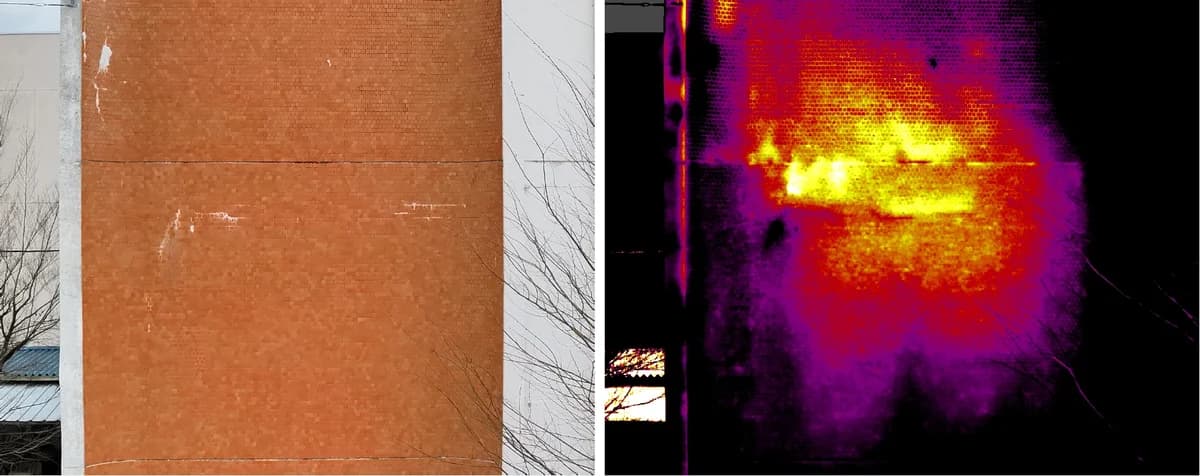
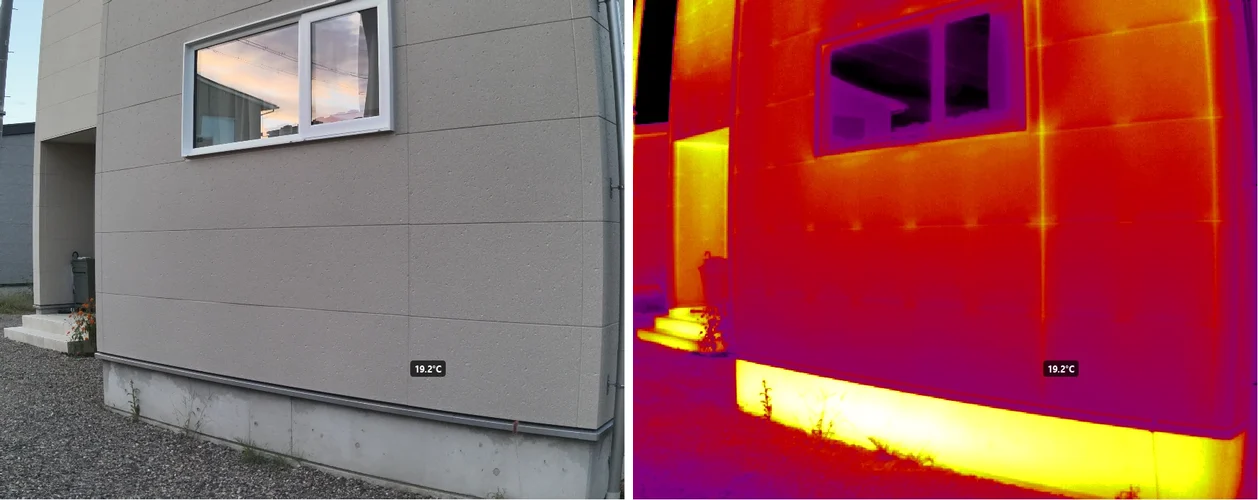
On the left is an ordinary photo; on the right, the same wall through a thermal camera. The left looks like a slightly stained tile wall. The right shows a bright band across the middle.
So is all of that bright band delaminated tile? The honest answer is "you can't tell from this alone." This article unpacks how infrared finds delamination and the traps that make other things look like it, using diagrams and real images.
What is a thermal camera actually seeing?
Every object emits infrared radiation from its surface, more strongly the warmer it is. A thermal camera measures that radiation and turns it into a map of surface temperature.
The key word is surface. The camera is not looking through the tile to see whether it has come loose.
Delamination only shows up when what is happening behind the tile reaches the surface as a difference in surface temperature. That difference comes from the thin air gap behind the loose tile.
By day: the air gap holds the heat
Japan's national guideline for infrared facade surveys defines delamination as a gap that forms at the bonded interface between different materials, such as tile, mortar and the concrete structure. In other words, behind a delaminated area there is a very thin air gap.
Air is a poor conductor of heat. When sunlight warms the wall, a well-bonded tile passes the heat through the mortar into the concrete behind it.
At a delaminated tile, the air gap blocks that path. The heat has nowhere to go and builds up at the surface, so only the delaminated area reads warmer than its surroundings. (The lower-left panel of the diagram in the next section shows this heat flow.)
After sunset: why it flips to cooler
This is the heart of the story. The same delamination can look cooler than its surroundings at a different time of day.
Once the sun leaves, the wall starts cooling. Now the heat flows from the concrete, which stored it during the day, out toward the air. The heat flows the opposite way.
The surface of a sound tile keeps getting topped up with heat from the concrete behind it. At a delaminated tile, that supply is cut off by the air gap. The surface tile is left on its own, cools first, and reads cooler.
The air gap is not doing anything different at night. It simply resists heat in either direction. Only the direction of the heat flow has changed, and so the whole pattern inverts.
Keep in mind that this is a simplified model of the heat flow. Whether the inversion shows up clearly in practice depends on the wall's orientation and how much sun it got, the thickness and material of the structure, how fast the air cools, wind, and the thickness of the gap. Not every wall inverts at night, and often the difference is simply too small to see.
On the way from warmer to cooler, there is a period when the difference between delaminated and sound areas is almost zero (around the dotted line in the chart). Shoot then, and nothing shows up even if delamination is there. "Nothing appeared" does not mean "nothing is wrong."
The contrast is far smaller than you'd expect
Japan's Building Research Institute placed tiled test panels with gaps of different thicknesses outdoors and recorded temperature and sunlight throughout the year.
For the panel with a 1.0 mm gap, the temperature difference from the sound area when the delamination was detected was about 0.4–0.5 °C all year round. For 0.5 mm and 0.1 mm gaps, sunlight had a stronger effect and the values varied widely between seasons.
The report names the amount of sunlight as the main cause of that variation, with thinner gaps more affected, and notes that when clouds block the sun the difference shrinks and detection takes longer. Its conclusion: to find thin delamination you need to shoot several times, spaced out over time.
A difference that a color palette paints bright red is often less than 1 °C in reality. That is exactly why it gets buried so easily under the disturbances in the next section.
Four conditions that hide the contrast
Delamination only creates a temperature difference while heat is flowing. When the flow is weak, the difference is small even if delamination is present.
| Condition | Why the contrast fades |
|---|---|
| Overcast sky | Less sunlight means less heat entering the wall. In the Building Research Institute tests, clouds reduced the difference and delayed detection |
| North face | Gets direct sun for only a very short time (in the Northern Hemisphere). Infrared surveys are considered very difficult there, so tapping is planned in |
| Shade | Shaded areas never warm up fully, and the shadow edge itself creates a temperature step that looks like delamination |
| Wind | Wind carries surface heat away and evens out the pattern. The guideline lists wind speed as an applicability condition |
The Japanese guideline asks surveyors to check, in a preliminary survey, which parts are unsuitable for infrared, considering weather (conditions, ambient temperature, wind speed), tile type, achievable viewing angle and distance, and spots infrared handles poorly, such as soffits and inside and outside corners. Whether rain before the survey has left the wall wet is also part of the plan.
The "cold corners" of drone thermal images
The Building Research Institute report describes a "shading" effect with drone-mounted thermal cameras: downwash from the propellers makes parts of the image read colder than reality. The suggested countermeasure is to plan shots so that the image corners are not used and analysis relies on the center. If an image is cold mainly around the edges, suspect the capture, not the wall.
The false-positive trap: walls are uneven without any delamination
Temperature patterns in a thermal image arise for plenty of reasons besides delamination. The Japanese guideline requires that delamination be judged while removing the influence of reflections and other disturbances.
Let's take the common ones in turn.
1. Reflection: glass and metal show their surroundings
Glass, metal and glossy finishes reflect infrared well. They read at the temperature of whatever they reflect, such as the sky or a nearby building, rather than their own.
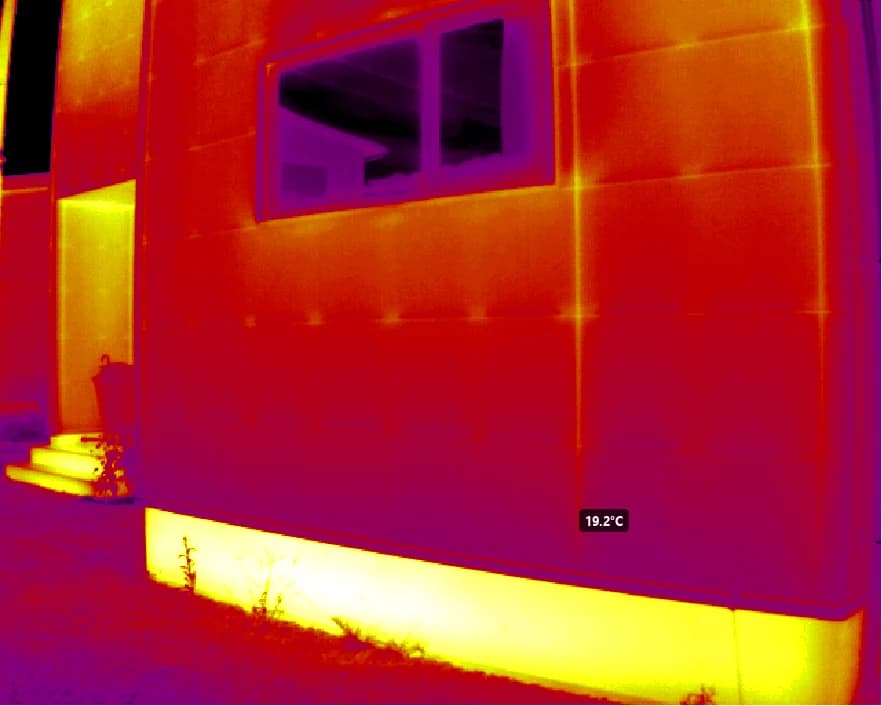
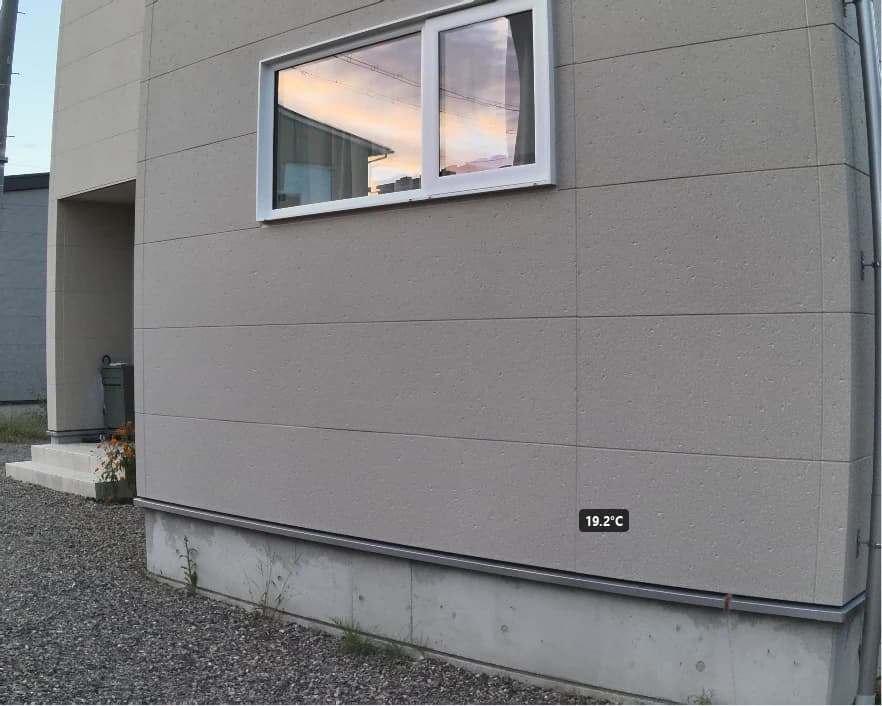
In the visible image the window also mirrors the evening sky and the house opposite. The same thing is happening in the infrared. Around windows, read temperatures from the frame or the wall, not the glass.
2–4. Color, material and equipment: one wall, many heating rates
Here is the same image with each cause of uneven temperature numbered.
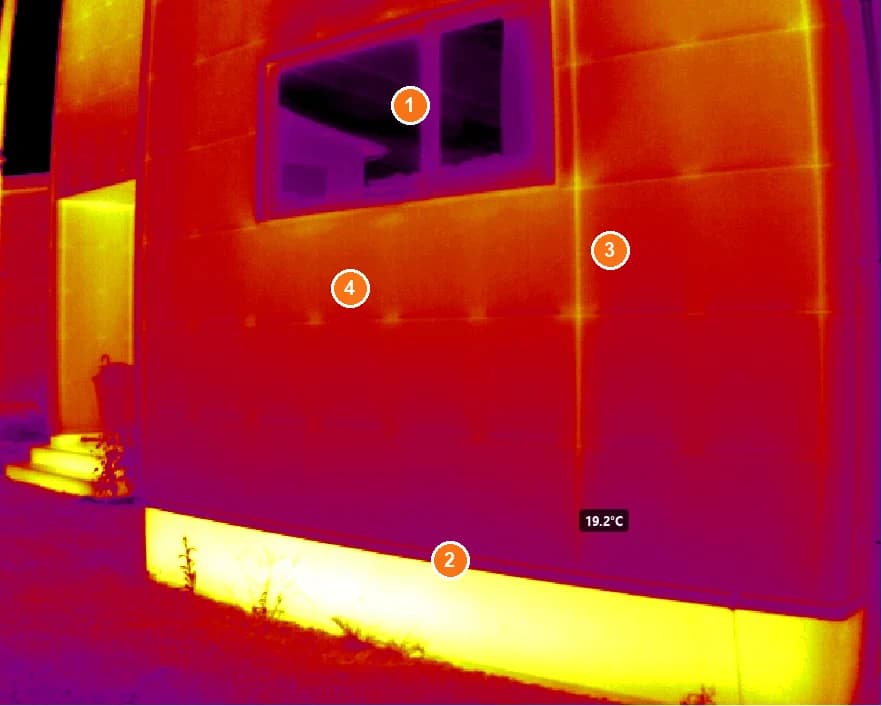
- 1 Window glass: reflection, mirroring the cold sky
- 2 Concrete foundation: much warmer than the siding. Different materials store and release heat differently
- 3 Vertical siding joint: a perfectly straight bright line that follows the panel joint and the framing
- 4 Row of bright dots: evenly spaced dots that appear to mark fasteners or other parts of the substructure
Each of these is "a different temperature from the surroundings," just like delamination. But either the cause is visible in the photo, or the shape is regular and follows the construction. That is not how the irregular, spreading patches of delamination look.
Color matters too. Dark finishes absorb more sunlight and run warmer than light ones at the same moment. Where tiles of different colors meet, the color boundary can become a temperature boundary.
Equipment heat, from AC units, vents, pipes or heat sources indoors, shows up as local hot spots. The guideline's instruction to account for "radiant heat from surrounding buildings and the like" when planning is about the same family of disturbances.
5. Shadow edges and uneven sunlight
When the shadow of a neighboring building or an eave falls across the wall, there is a temperature step between sun and shade. A crisp, straight edge is a strong hint that you are looking at a shadow. Timing the survey to avoid this is a planning topic in its own right. For buildings in Japan, the free CRITIR Thermal Planner simulates when each face is in sun or shade.
Don't judge by color intensity
One more common trap: the display range (which temperatures get which colors) completely changes how the same image looks.
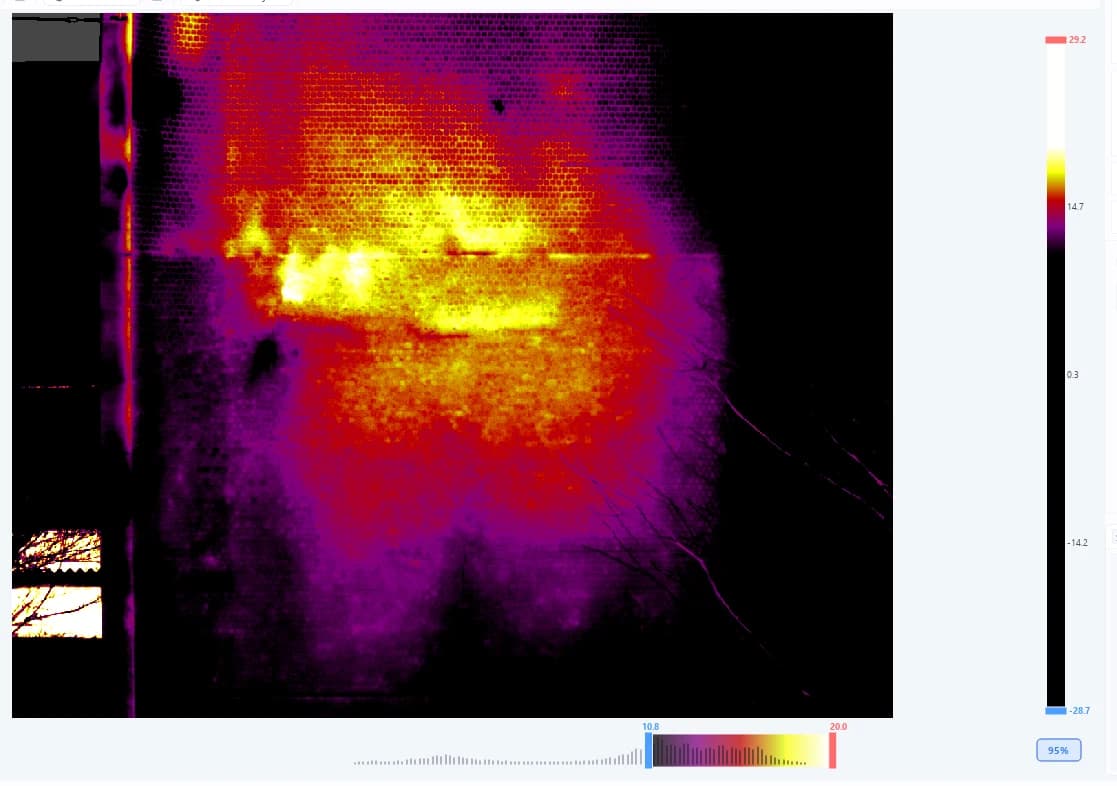
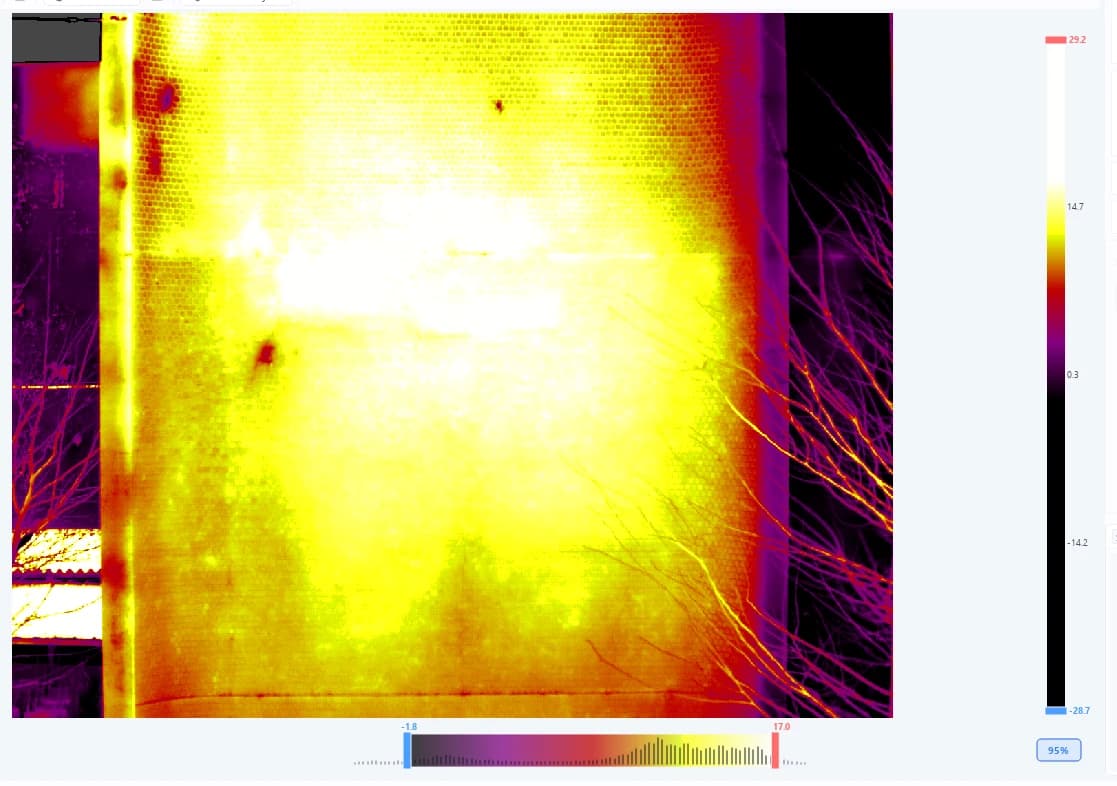
Tighten the range and a difference of less than 1 °C splits into bright red and black. Widen it and real delamination disappears. Judge by temperature values, shape and position, not by "it looks very red."
Telling them apart: work by elimination
Put together, here is the order to check things in when you find a temperature anomaly.
The point is not to try to name delamination directly. Eliminate the explainable causes one by one, and keep only the irregular patches that none of them explain as "suspected delamination."
Back to the wall at the top of the article. Overlaying the outlines from the visible image on the thermal image lets you read how the warm areas relate to joints, lines and stains.
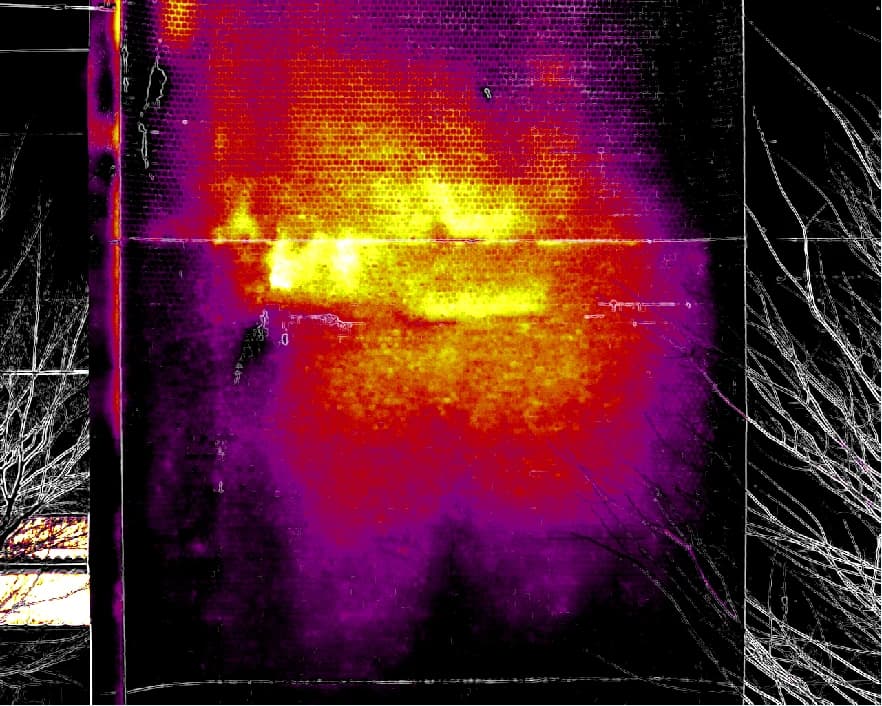
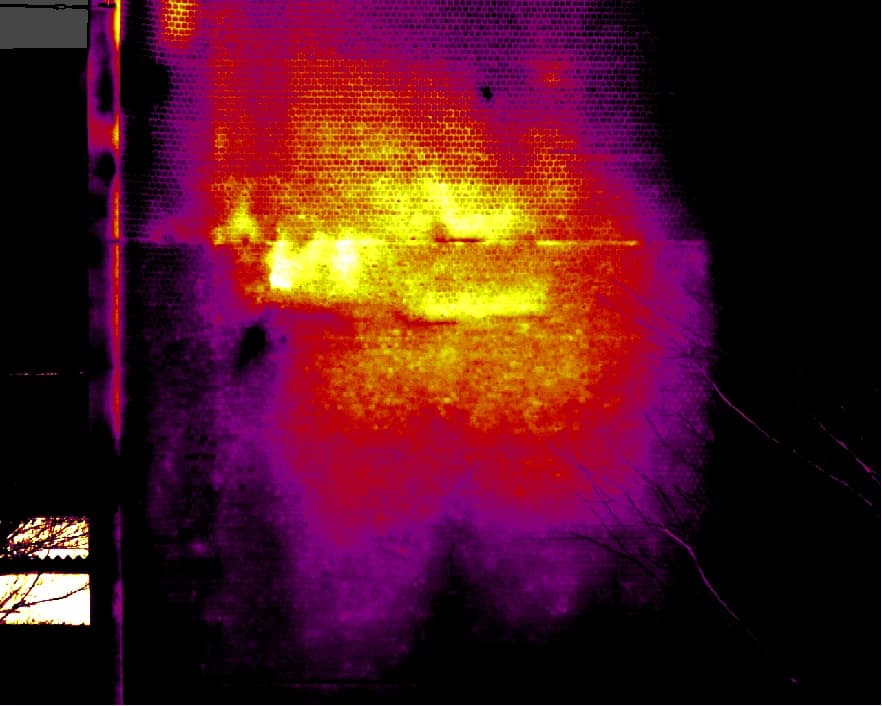
The visible image of this wall shows several horizontal white streaks. Stains and repair marks like these can also cause uneven temperatures, which is why the guideline notes that combining visible images makes stains, repairs and shading clear and the judgment more accurate. The parts of the warm area that spread independently of stains and building elements are the ones to check by tapping.
When in doubt, take one more shot at another time or angle
Reflections move when you change the viewing angle; shadows move when the time changes. Delamination is fixed to the wall and doesn't move. If a patch appears in the same spot in images taken from another angle or at another time, delamination becomes more likely. That is the same logic behind the Building Research Institute's advice to shoot thin delamination several times.
Infrared and hammer tapping: partners, not substitutes
In Japan, a 2022 revision of the rules for periodic building inspections made it explicit that facade surveys may use infrared surveys by drone, provided they are at least as accurate as hammer tapping. That did not make tapping obsolete.
The national guideline requires that before the main survey, the same area be tested with both tapping and infrared to confirm how delamination appears in the thermal images, and that areas where detection is difficult be handled by changing the conditions or by tapping.
The two methods look at different things.
| Hammer tapping | Infrared survey | |
|---|---|---|
| What it senses | The sound when struck (how well the finish is bonded) | Surface temperature differences (how heat flows) |
| Strengths | Checks each tile reliably | Covers large areas at once and leaves an image record |
| Weaknesses | Needs scaffolding or work at height; hard to document | Depends on sunlight, weather, time, orientation and disturbances |
The Building Research Institute report includes a case where tapping found hollow sounds over a wide area but infrared could not detect delamination. A pull-off adhesion test found no delamination of the tiles themselves; the likely cause was voids inside the concrete, such as honeycombing. Not everything that sounds hollow is a delaminated tile.
Use infrared to scan wide areas and flag suspects, and tapping to confirm them and to cover what infrared handles poorly. Thinking of them as complementary is closer to reality.
Making the "telling apart" faster with CRITIR
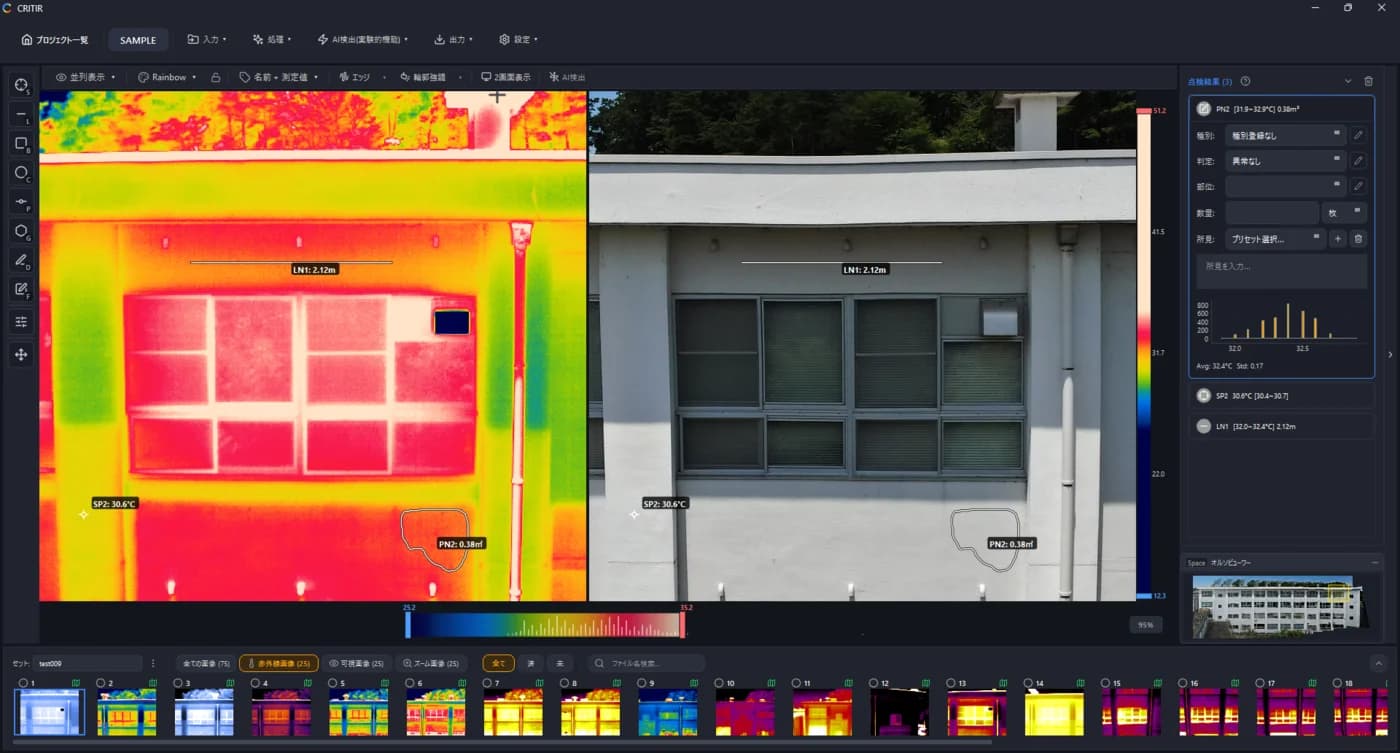
All of the checks above come down to repeating three things: compare with the visible image, tighten the display range, and line up other photos of the same spot. CRITIR, our thermal image analysis software, is designed to keep that back-and-forth on one screen.
- Compare with the visible image instantly: side-by-side thermal and visible views and a quick visible check (the V key) let you see whether a reflection, stain or piece of equipment is behind a patch (Viewer)
- Overlay outlines: draw the edges from the visible image on top of the thermal image to see how anomalies line up with joints and members (Thermal analysis)
- Fit the display range to the wall: hold Shift and move the mouse to tune contrast while looking at the image. Alarms can keep only the areas above a chosen temperature in color
- Line up other photos of the same spot: click a point in an image or orthoimage to list every photo that shows it and compare them side by side, handy for checking whether a patch moves with angle or time (Location search)
- Fix measurement parameters afterward: for FLIR and DJI images, re-set emissivity and reflected temperature and recalculate temperatures
General guidance on capture conditions is collected in Shooting tips.
For supported cameras, features and pricing, see the CRITIR product page.
Summary
- An infrared survey sees surface temperature differences, created when the air gap behind delamination blocks heat flow
- While heating, delaminated areas read warmer; while cooling after sunset, they read cooler. Around the changeover the contrast disappears
- The difference is often below 1 °C, and overcast skies, north faces, shade and wind shrink it further
- Reflections, color, materials, equipment heat and shadow edges also create temperature patterns. Compare with the visible image and work by elimination
- Scan wide areas with infrared and confirm by tapping. The Japanese guideline assumes the two are used together
Sources
- Ministry of Land, Infrastructure, Transport and Tourism (Japan), "Guideline for facade surveys by infrared inspection (including infrared inspection by unmanned aircraft) under the periodic reporting system" (March 2022, Japanese; index page)
- Building Research Institute (Japan), "Examination of various environmental factors affecting the accuracy of infrared diagnostic methods for exterior wall diagnosis" (research completed FY2021, Japanese)
- Nippon Avionics, "Principles of building diagnosis (exterior walls)" (Japanese)
- Nippon Avionics, "Glossary: emissivity" (Japanese)
Emissivity and reflected temperature on thermal cameras: why your readings don't match, and how to fix them
Thermal camera readings that disagree with a contact thermometer, windows and metal that look impossibly cold — most of the time it is not a faulty camera but emissivity and reflected temperature settings. This guide explains what a thermal camera actually measures, lists typical emissivity values by material, shows how to measure reflected temperature with aluminum foil, and covers distance and humidity, why metal and glass are hard, and how to correct the settings after capture.
Generate facade and wall orthoimages automatically with CRITIR
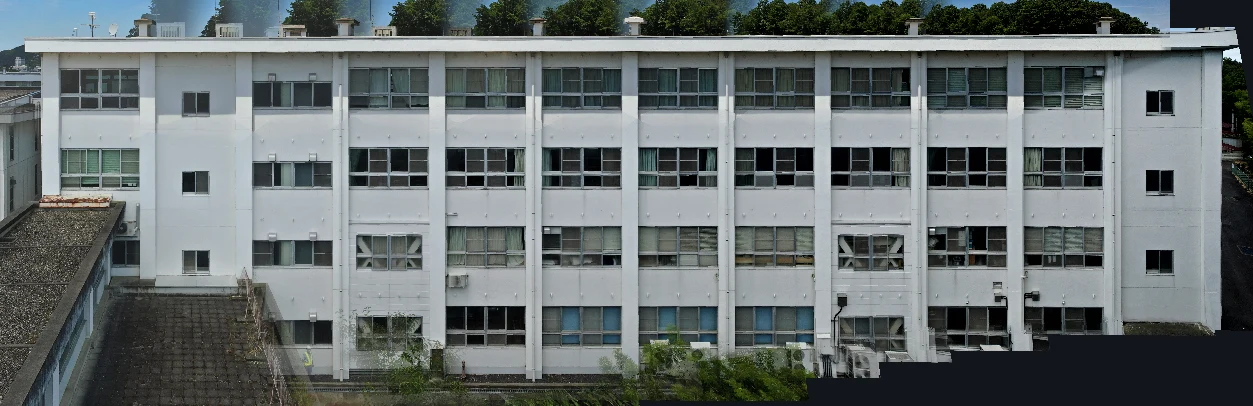
A clear walkthrough of how facade and wall orthoimages are built from drone or ground-camera shots, and how CRITIR simplifies the process. Where RealityCapture (RealityScan) and Metashape require significant manual work for vertical surfaces, CRITIR automates the pipeline — including thermal orthoimages — to streamline facade inspections and defect surveys.
Generate 3D Models from Drone Photos — Build Temperature-Colored (Thermal) 3D Models with CRITIR
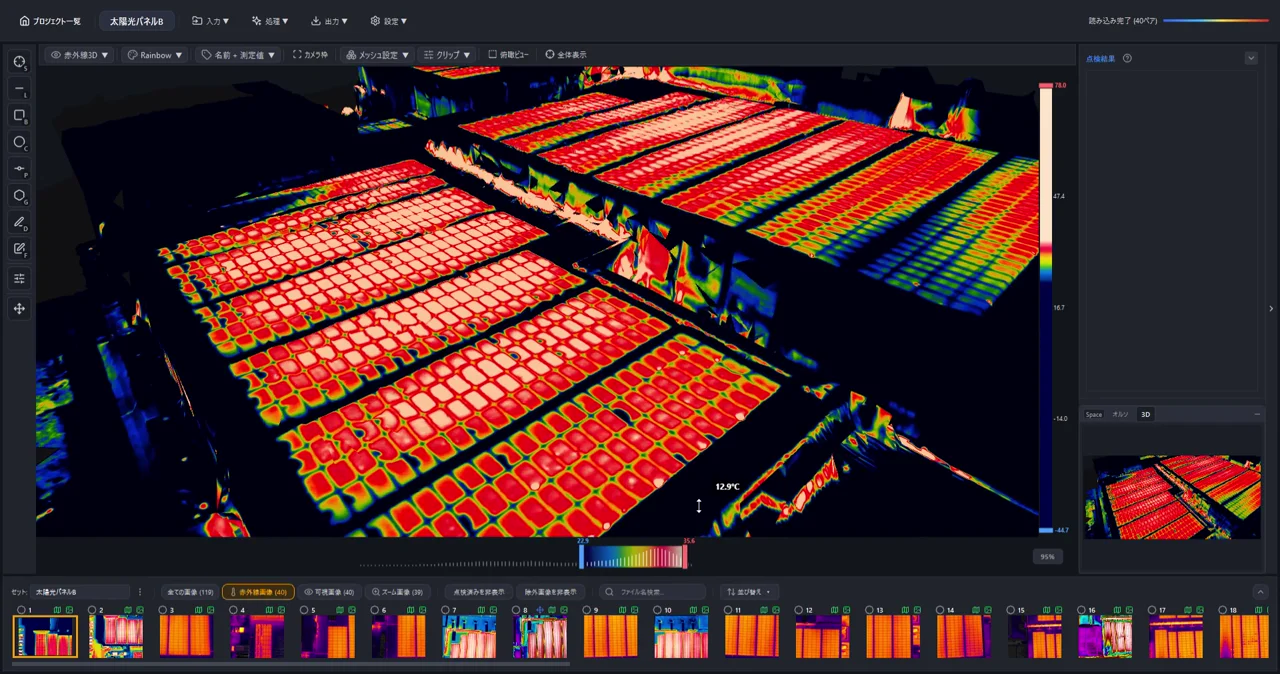
Learn how to automatically generate 3D models of buildings and structures from drone or ground-camera photos. With CRITIR, you get a visible-light 3D model plus a temperature-colored thermal 3D model, all linked to measurements and report output — streamlining inspection documentation for complex facades, equipment, and solar panels.