
Solar panel infrared inspection: what causes hot spots and how to find them
Why do hot spots form on PV modules? This illustrated guide lines up the typical thermal patterns (cracked cells, soiling and shade, bypass diodes, whole strings down) by the shape they leave in a thermal image, then covers the capture conditions (600 W/m² irradiance, system operating, avoiding reflections), the drone inspection workflow, why an orthomosaic of the whole array helps, and what goes into the report, with IEC TS 62446-3 and industry guidelines as sources.
Key points
- A hot spot is a cell that cannot generate being forced to carry the current of the cells around it, turning that power into heat. Shade, soiling, cracked cells and bypass-diode problems are the usual triggers.
- Read thermal images by the shape of the warm area. One cell, the outline of dirt, one third of a module, a whole module, a run of modules or a patchwork each point to different causes.
- Capture conditions decide the outcome. At least 600 W/m² on the module plane, system operating, stable weather, and an angle that avoids reflections.
- Seeing the whole array in one image shows location and extent. String-level faults are easy to miss when you look at photos one at a time.
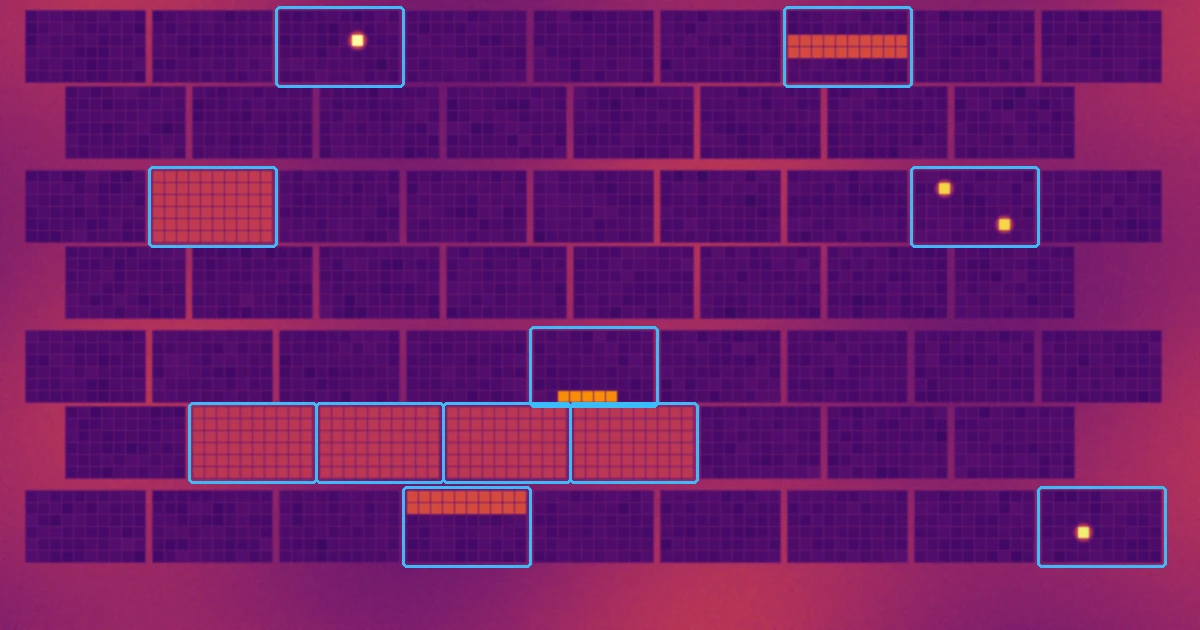
Illustration for explanation only (not a real image).
"Output seems a bit lower than last year." Anyone who manages a solar plant has heard this.
Yet on site, every panel looks exactly the same. Finding the bad ones among hundreds or thousands by eye is close to impossible.
That is where a thermal camera comes in. Parts of the array that are not contributing to generation give themselves away as heat. This article walks through how to read that heat, with diagrams along the way.
What is a hot spot, and why does a single cell get hot?
Inside a PV module, many cells are connected in series. In a series circuit, every element has to carry the same current.
Now suppose one cell is shaded, or cracked so it can no longer generate. It cannot produce current on its own, yet the current made by the other cells is forced through it. The cell ends up reverse-biased, behaves like a resistor and converts power into heat. That is a hot spot.
To limit this heating, most modules have a bypass diode for each group of cells. A typical 60-cell module has three such groups, and when a diode conducts, the current detours around its group.
The bypassed group stops generating, and the sunlight it absorbs simply becomes heat. The result is one third of the module looking uniformly warmer. If the cause is shade, it recovers once the shade moves. If the diode itself has failed short, that third stays out of service even on a clear day.
Hot spots do more than cost energy. Sustained local heating can discolor or scorch the backsheet and accelerate degradation. The international technical specification for this work, IEC TS 62446-3, names preventive maintenance for fire safety among its purposes.
Read the shape: six typical patterns
Where a module warms up, and how large the warm area is, gives a useful first guess at the cause. These are the patterns you will meet most often.
| Pattern | Warm area | Suspect first |
|---|---|---|
| 1. One hot cell | A single cell (or part of one) | Cracked cell, bad solder joint, a leaf or bird dropping on top |
| 2. Follows soil or shade | Traces the dirt or shadow outline | Mud at the lower edge, overgrown weeds, shadows from structures |
| 3. One third is warm | One cell group | Bypass diode conducting, or a shorted diode |
| 4. Whole module warm | One module | Not delivering power (disconnected, open circuit, etc.) |
| 5. A run of warm modules | A whole string | Fuse, combiner box, wiring or inverter-side outage |
| 6. Patchwork | Cells scattered irregularly | Cell degradation; if concentrated near the frame, suspect PID |
Soiling (pattern 2) is the kind of fault you can wash off, but left alone it damages cells by the same mechanism as pattern 1. For patterns 1 and 2, a quick visual check for dirt or debris is usually the fastest next step.
Normal temperature variations that look like faults
Thermal images also show temperature differences that are not faults. The PV maintenance guideline published by Japan's electrical manufacturers' association (JEMA) and photovoltaic energy association (JPEA) asks inspectors to identify these normal variations first:
- Near the junction box, heat escapes poorly, so it tends to run warmer.
- Module edges, labels, the area right next to the frame and mounting points commonly show temperature gradients.
The same guideline notes that array temperature swings widely from day to day with irradiance, wind and air temperature, so absolute temperature thresholds are of little use and the difference from the surroundings matters most. The question is not "is it above X °C" but "how much hotter is it than its neighbors".
A thermal image cannot confirm the cause on its own. The guideline calls for recording the location of each temperature difference and investigating it with visual inspection and electrical tests at string and module level. Comparing the I-V curve with that of a healthy module is another useful tool.
When and how to capture: conditions decide the result
Infrared inspection is largely won or lost before you take the first image. Under poor conditions, faults simply do not produce a temperature difference.
At least 600 W/m², with the system operating
IEC TS 62446-3 sets 600 W/m² in the plane of the modules as the minimum irradiance for module inspection. Faults such as a string being down or PID produce only small temperature differences, roughly proportional to irradiance. With weak sunlight they may not show at all.
The other prerequisite is that the system is generating normally. The JEMA/JPEA guideline asks for the array to be in its normal operating mode, with the inverter tracking the maximum power point (MPPT), under stable weather.
Temperature responds much more slowly than electrical output. While clouds are passing and irradiance is going up and down, the thermal image cannot keep up. Capturing after at least about 15 minutes of unchanged weather is widely recommended.
A real example: the wrong conditions
The image below is part of a thermal orthomosaic of a real ground-mounted solar array, captured by drone on a March evening (only the module rows are cropped out).
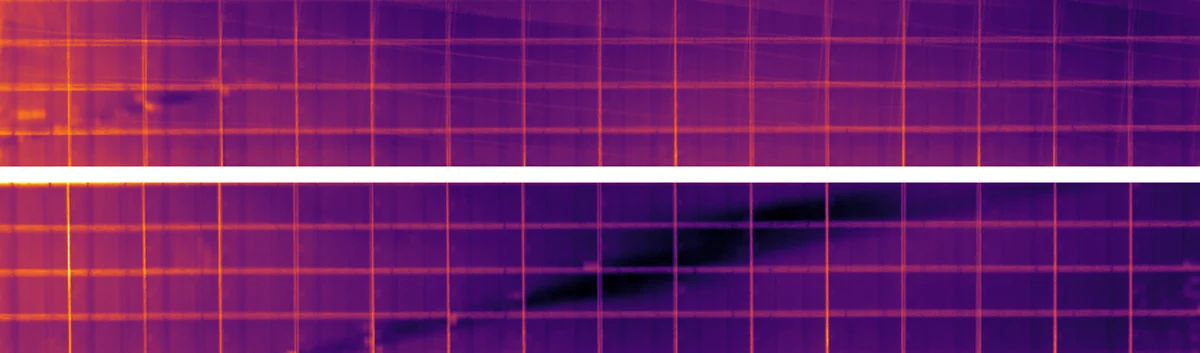
Real capture (part of a thermal ortho made in CRITIR; display range −7 to 2 °C)
The modules sit at around −4 °C, colder than the ground around them. Irradiance is too low for the modules to warm up from generation, and the glass is reflecting the cold sky. All that stands out is the grid of module joints and a dark band from sky reflection — under these conditions there is no way to find hot spots.
The same array captured while it is in strong sun and generating would look completely different. Before reading a thermal image, make a habit of checking when it was taken.
Avoid reflections of the sun and sky
The front of a module is glass, and glass acts like a mirror in the infrared too. Shoot from the angle of the sun's specular reflection and that patch lights up as if it were a fault.
Tilt too far the other way and the glass reflects the cold sky, making temperatures read low. The basic rule is to stay off the reflection direction while keeping the view as close to face-on as you can. With a drone, a small change in heading or gimbal angle is often enough to get rid of a reflection.
The JEMA/JPEA guideline notes that viewing the array from the back minimizes interference from light reflected by the glass, but viewing from the front generally gives a clearer image thanks to the glass's thermal conduction. When shooting from the front, the camera and operator (or drone) must not cast a shadow on the area being inspected.
Resolution: can you see inside a cell?
To find a hot spot confined to a single cell, each cell needs to span several pixels. Under IEC TS 62446-3, the guideline is that one pixel covers at most 3 cm on the module surface. Because modules are tilted, think in terms of resolution on the module plane rather than ground sampling distance (GSD).
Flying higher covers more ground per image, but the pixels get coarser. Decide in advance how to balance "finish quickly" against "do not miss small faults".
The drone inspection workflow
The larger the plant, the more a drone pays off. A typical workflow looks like this:
- Preparation: obtain the array layout and string configuration, and plan the flight route and altitude (which sets the resolution). Follow local aviation regulations.
- On-site checks: measure plane-of-array irradiance with a pyranometer and confirm the system is operating normally. Record air temperature, wind and cloud cover.
- Capture: fly the whole array with overlap, heading in a direction that avoids reflections.
- Analysis: pick out areas hotter than their surroundings, measure the temperature difference and use the pattern to narrow down the cause.
- Locate: identify each fault on the layout, by row and position.
- Verify and report: confirm with visual checks or electrical tests and write it up.
Steps 4 and 5 are where time disappears. Going through hundreds of photos one by one, you end up looking at the same module several times or missing a fault that falls on the seam between two images.
Why look at the whole array as an orthomosaic?
This is where an orthomosaic helps: many photos stitched into a single, map-like image seen straight down (or straight at a surface).
In an orthomosaic you can see at a glance:
- How a fault spreads: a string outage (pattern 5) only reads as "a warm row" when you see many modules side by side. Within a single photo it can look like just one warm module.
- Where it is: you can count "third row from the north, twelfth module from the west" directly, which feeds straight into marking locations on the layout, as the guideline asks.
- How many there are: double-counting the same fault, or losing one at a photo boundary, becomes much less likely.
We explain how orthoimages are built in Generate facade and wall orthoimages automatically. The idea is the same for arrays on the ground.
What goes into the report?
The key test for an infrared inspection report is whether someone could reproduce the same conditions later. IEC TS 62446-3 itself covers measurement equipment, environmental conditions, inspection method and reporting. Typical contents:
- Capture conditions: date and time, plane-of-array irradiance, air temperature, wind, cloud cover, camera used
- Each fault: location (on the layout or orthomosaic), thermal and visible images, temperature difference from the surroundings, pattern and likely cause
- Assessment and action: cleaning, part replacement, further electrical testing, or whatever comes next
With temperature differences and locations side by side, the next inspection can also tell you whether a fault has grown since last year.
What CRITIR can do
CRITIR is inspection software that takes you from thermal image analysis to the finished report in one application. For PV inspection, it helps with the following.
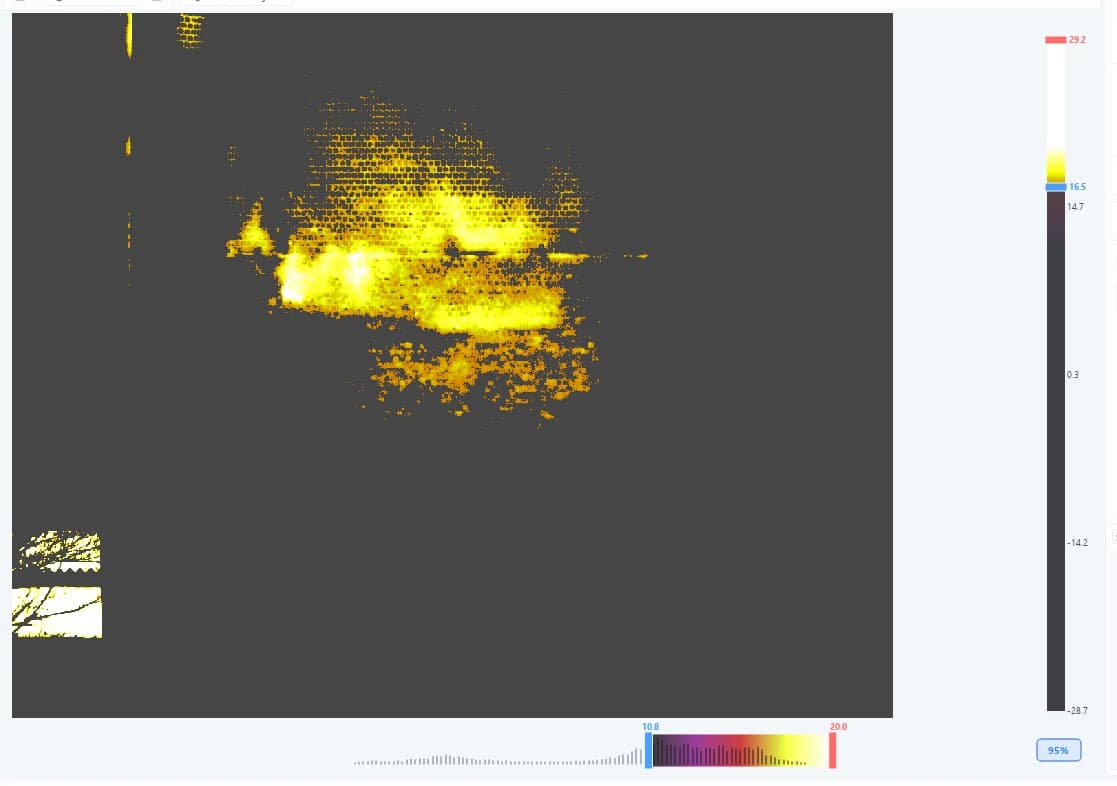
Making temperature differences easy to see: narrow the displayed temperature range to the target, or use the alarm to highlight only areas above a chosen temperature.
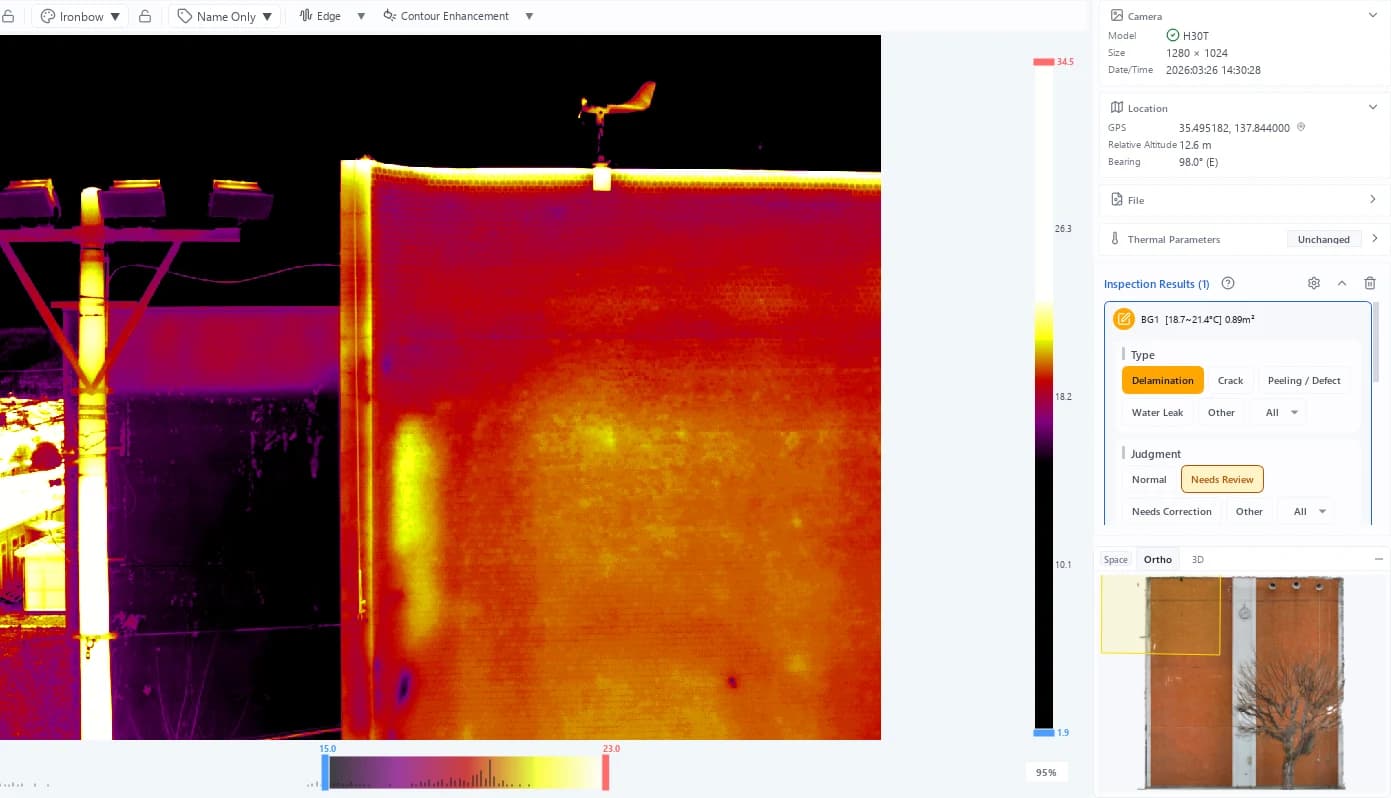
Measuring and recording: draw a box or polygon to get the maximum, minimum and average temperature of the area, and turn it straight into an inspection record with type, judgment and notes. You can add your own types in the inspection input settings, for example "Hot spot" or "Cell group" for PV work.
Turning the array into an orthomosaic: the 3D model ortho mode suits scenes that a single plane cannot represent well, such as solar panel scenes. You define the face and extent you want on the 3D model with a box.
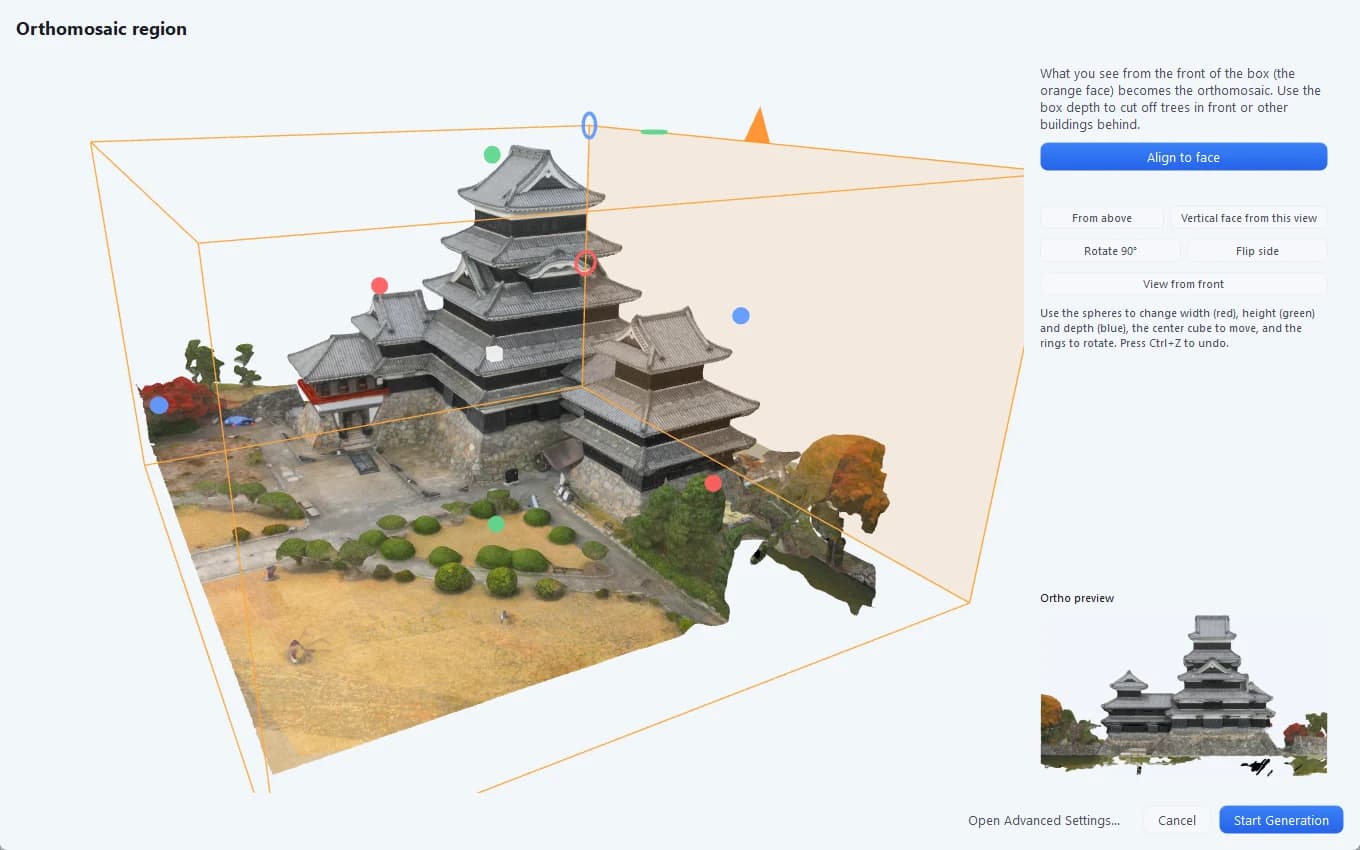
Compiling the report: choose a template and CRITIR assembles a report from your measurements, ready to export as PDF, Word and more.
Each step is covered in the documentation: Thermal analysis, Measurement tools, Ortho generation and Report creation. For supported cameras and pricing, see the CRITIR product page.
Frequently asked questions
- What is a hot spot on a solar panel?
- A part of a PV module that runs noticeably hotter than its surroundings. When one cell in a series string cannot generate, because of shade, soiling or a crack, the current produced by the other cells is forced through it and it dissipates power as heat, much like a resistor. In a thermal image that area shows up bright.
- Can you tell the cause of a hot spot from the thermal image?
- The size and shape of the warm area give a good first guess. A single cell points to a cracked cell or local soiling; one third of a module uniformly warm points to a conducting or failed bypass diode; a whole module or a run of modules points to a disconnected module or a string that is down. A thermal image alone cannot confirm the cause, so it is combined with visual inspection and electrical tests such as I-V curve measurement.
- What conditions are needed for thermal imaging of PV modules?
- IEC TS 62446-3 sets a minimum irradiance of 600 W/m² in the plane of the modules. The system should also be operating normally with the inverter tracking the maximum power point, the weather should be stable with no passing clouds, and the viewing angle should avoid reflections of the sun and sky in the glass.
- What are the advantages of drone-based PV inspection?
- A drone can cover a large array quickly, while conditions stay the same. Compared with walking the rows, it also makes faults that span several modules, such as a whole string being down, easier to notice. Building an orthomosaic from the images makes it easy to locate each fault by row and position and to prepare the report. Drone flights must follow local aviation regulations.
Summary
Infrared inspection of solar panels relies on one fact: places that are not generating show up as heat.
- A hot spot is a cell that cannot generate being forced to carry other cells' current and heating up.
- Read the shape: one cell, a soiling outline, one third, one module, a run of modules or a patchwork each point to different causes.
- Look at the difference from the surroundings, not absolute temperature, and learn the normal warm areas around junction boxes and frames.
- Conditions decide the result: at least 600 W/m², system operating, stable weather, an angle that avoids reflections and enough resolution.
- An orthomosaic of the whole array shows where each fault is and how far it spreads.
If you have questions about planning or analyzing an inspection, feel free to reach out via the contact form.
Sources
- IEC TS 62446-3:2017, Photovoltaic (PV) systems – Requirements for testing, documentation and maintenance – Part 3: Photovoltaic modules and plants – Outdoor infrared thermography (IEC Webstore)
- JEMA / JPEA, Guideline on maintenance of PV systems (in Japanese), technical document JM16Z001, December 2016. Annex D.7.4, infrared thermography test of PV arrays
- C. Buerhop et al., "Infrared imaging of photovoltaic modules: a review of the state of the art and future challenges facing gigawatt photovoltaic power stations", Progress in Energy 4(4), 042010, 2022
- S. Gallardo-Saavedra et al., "Analysis and characterization of PV module defects by thermographic inspection", Revista Facultad de Ingeniería Universidad de Antioquia, 2019
Published: October 7, 2026 / Last updated: October 7, 2026
Emissivity and reflected temperature on thermal cameras: why your readings don't match, and how to fix them
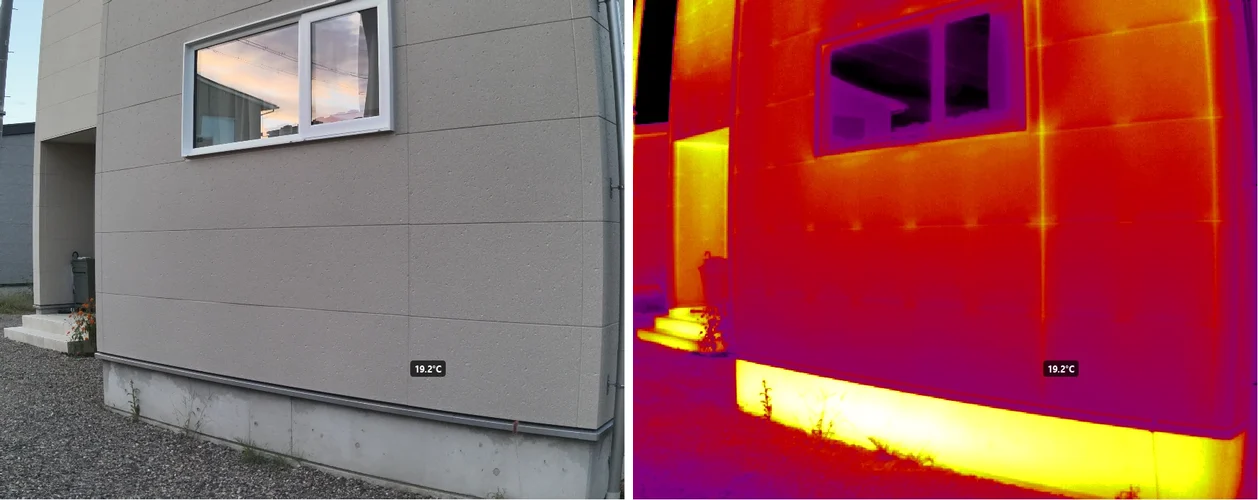
Thermal camera readings that disagree with a contact thermometer, windows and metal that look impossibly cold — most of the time it is not a faulty camera but emissivity and reflected temperature settings. This guide explains what a thermal camera actually measures, lists typical emissivity values by material, shows how to measure reflected temperature with aluminum foil, and covers distance and humidity, why metal and glass are hard, and how to correct the settings after capture.
What is an orthophoto? How it differs from a photo, explained with diagrams — from aerial maps to building facades
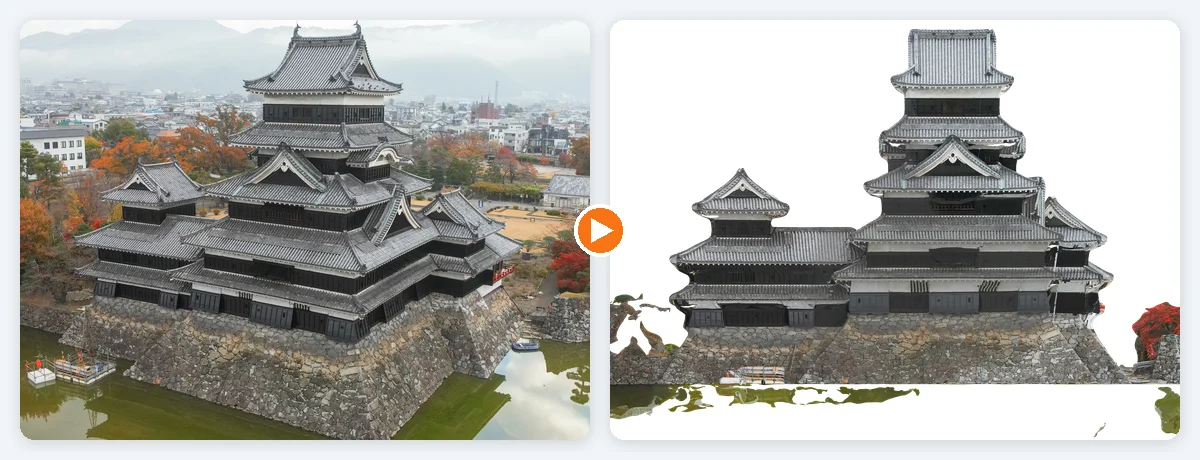
A visual introduction to orthophotos (orthoimages) and how they differ from ordinary photos. Covers relief displacement (why tall buildings lean outward), true orthophotos, the four steps from photos to an orthophoto, map orthos versus facade orthos, and the conditions where orthophotos fail — with real examples from Matsumoto Castle and a retaining wall.
Generate facade and wall orthoimages automatically with CRITIR
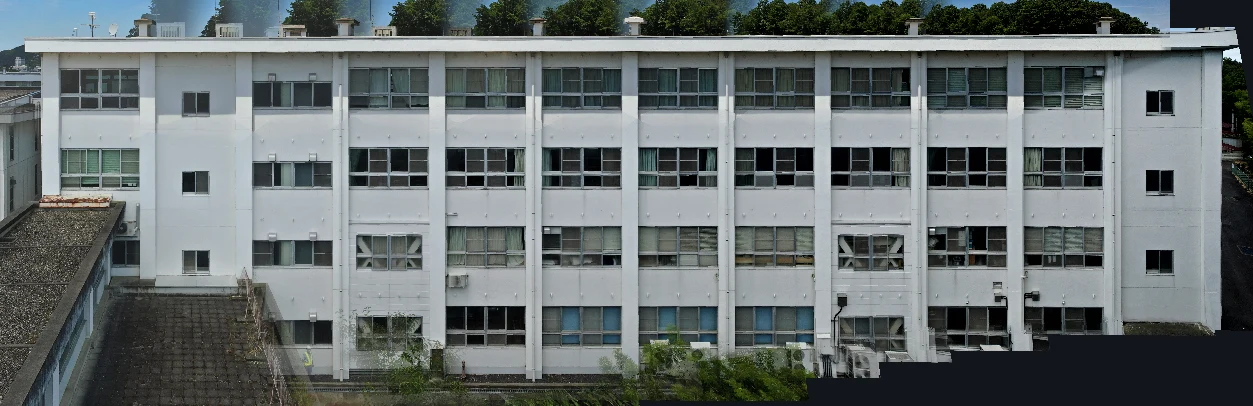
A clear walkthrough of how facade and wall orthoimages are built from drone or ground-camera shots, and how CRITIR simplifies the process. Where RealityCapture (RealityScan) and Metashape require significant manual work for vertical surfaces, CRITIR automates the pipeline — including thermal orthoimages — to streamline facade inspections and defect surveys.