
How to choose a drone thermal camera for inspection: resolution, field of view, temperature measurement and data format
A visual guide to choosing a drone thermal camera. Compare 640×512 and 1280×1024 by working out how many centimeters one pixel covers on the target, check whether the camera is radiometric, understand R-JPEG and other data formats, pair it with a visible camera, and handle high-resolution modes. Includes official specs for the DJI Matrice 30T, Mavic 3T, Matrice 4T, Zenmuse H20T and H30T, and Skydio X10.
Key points
- Compare "centimeters per pixel on the target", not the pixel count in the catalog. It depends on resolution, field of view and distance, and takes one simple formula
- A narrower field of view gives finer detail but covers less per image. You are trading detail against the number of images (and flight time)
- Only radiometric cameras let you measure temperatures afterwards. Check the photo format and how the temperature data is read (which software supports it)
- Treat super-resolution and high-resolution modes as a different thing. The image may have more pixels than the sensor, and some software cannot re-apply measurement settings to them
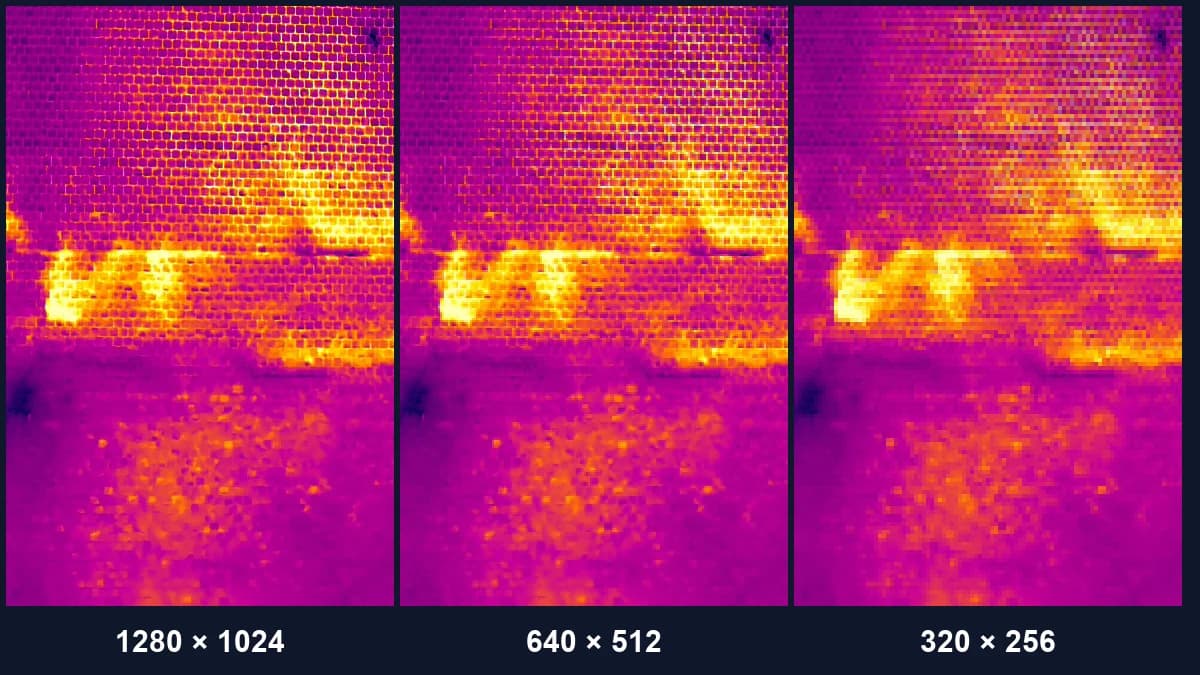
On the left is part of a thermal image of a tiled wall taken with a Zenmuse H30T (1280×1024). The middle and right panels are the same image downsampled to simulate 640×512 and 320×256. On the left you can follow the joints of individual tiles; on the right the tiles melt away and only the warm band remains.
"Which thermal drone should we buy?" Lining up "640×512" and "1280×1024" from the brochures does not tell you what changes on site. This article starts by translating the numbers into site terms (how many centimeters on the wall), then walks through temperature data, data formats and visible cameras, the other things worth checking.
Five things to check
Here is the overview first. You can compare inspection thermal cameras on these five points.
| Point | What to look at | Why it matters |
|---|---|---|
| 1. Thermal resolution | 640×512, 1280×1024, etc. | At the same distance and field of view, more pixels means finer detail |
| 2. Field of view (and distance) | Diagonal FOV, equivalent focal length | Together with resolution, sets the pixel size and the coverage per image |
| 3. Temperature measurement | Measurement modes, range, accuracy | Reading and comparing temperatures later requires a radiometric camera |
| 4. Data format and access | Photo format such as R-JPEG, supported software | Temperature data is useless if your analysis software cannot read it |
| 5. Visible camera pairing | Visible resolution, FOV, alignment | Confirms what a thermal anomaly actually is |
Points 1 and 2 mean little on their own. Combining them into a single number, the size of one pixel, is the shortcut.
Think in "centimeters per pixel", not "how many pixels"
Each pixel of a thermal camera records one value for a patch of the target's surface. The size of that patch is a guide to how fine a detail you can resolve.
That does not mean an anomaly one pixel across can be found or measured. To measure a target's temperature reliably it has to span several pixels: FLIR's technical guidance suggests at least 3×3 pixels on the target, ideally 10×10 or more. How large it needs to be also depends on the target and the conditions.
The patch grows as you move away from the target. The pixel count does not change, but double the distance and each pixel covers twice as much.
Let's calculate: one pixel on a wall 10 m away
For a square-on shot, the pixel size near the image center is roughly:
Pixel size ≈ distance × 2 × tan(diagonal FOV ÷ 2) ÷ pixels along the diagonal
All it does is divide "the length covered by the image diagonal" by "the number of pixels along that diagonal". Most manufacturers list the diagonal field of view in their specs.
Take a Mavic 3T (61° diagonal, 640×512) shooting a wall 10 m away:
- Length covered by the diagonal: 10 m × 2 × tan(30.5°) ≈ 11.8 m
- Pixels along the diagonal: √(640² + 512²) ≈ 820 pixels
- Pixel size: 11.8 m ÷ 820 ≈ 1.4 cm
Applying the same calculation to the main models gives:
The values scale with distance: twice as large at 20 m, three times at 30 m.
Oblique shots make pixels even larger
The formula is an estimate for a square-on shot near the image center. When you shoot at an angle, such as looking up at a facade, each pixel is stretched across the surface. Lens distortion also changes it slightly toward the edges. Do not plan right at the limit of the detail you need; leave some margin.
A narrower FOV is finer, but covers less
In the chart, the Matrice 4T and Zenmuse H20T resolve finer detail than the Mavic 3T even though all three are 640×512, because their field of view is narrower (more telephoto). The trade-off is that each image covers less.
At 10 m, the width covered by one image is roughly 9 m for the Mavic 3T (61° diagonal) and about 6 m for the Zenmuse H20T (40.6° diagonal). Covering the same wall takes correspondingly more images.
So the field of view is a tug-of-war between detail and effort. A narrow FOV and more pixels help when you must shoot a structure from far away; a wider FOV gets a low-rise facade done quickly when you can fly close.
1280×1024 is like shooting from half the distance
With the same field of view, a camera with twice the pixels in each direction gives the same detail as shooting from half the distance. In the opening image, think of the middle panel (640×512 equivalent) as the view from twice as far as the left (1280×1024), and the right panel (320×256 equivalent) as four times as far.
This only holds when the fields of view match. The Zenmuse H30T (1280×1024, 45.2° diagonal) and the Matrice 4T (640×512, 45° diagonal) have almost the same FOV, so the relationship applies directly. For cameras with different FOVs, always convert to pixel size before comparing.
The main models side by side
These specs are taken from the manufacturers' official spec pages (checked in October 2026). Specs can be revised, so check the current official pages before buying.
| Model | Thermal photo resolution | High-res mode | Diagonal FOV (equiv. focal length) | Range (high gain) | Photo format | Visible camera photo (typical) |
|---|---|---|---|---|---|---|
| DJI Matrice 30T | 640×512 | 1280×1024 with super-resolution | 61° (40 mm) | -20 to 150 °C | — | 12 MP (effective) |
| DJI Mavic 3T | 640×512 | — | 61° (40 mm) | -20 to 150 °C | JPEG, R-JPEG | 8000×6000 |
| DJI Matrice 4T | 640×512 | 1280×1024 with super-resolution | 45°±0.3° (53 mm) | -20 to 150 °C | JPEG, R-JPEG | 8064×6048 |
| DJI Zenmuse H20T | 640×512 | — | 40.6° (58 mm) | -40 to 150 °C | R-JPEG | 4056×3040 |
| DJI Zenmuse H30T | 1280×1024 | UHR infrared image supported | 45.2° (52 mm) | -20 to 150 °C | R-JPEG | 8064×6048, 4032×3024 |
| Skydio X10 (VT300-Z) | 640×512 | — | 41° (60 mm) | -40 to 150 °C | JPEG, RJPEG | 9248×6944 (Narrow) |
"—" means we could not find the item on the official spec page (not that the feature or value does not exist). The Matrice 30T's thermal resolution, super-resolution mode and measurement range are not on its official spec page, so they come from DJI's user manual (MATRICE 30 SERIES User Manual v1.0). The visible-camera column shows a typical camera, since models carry different types (wide, narrow and so on); for the Skydio X10 VT300-Z it is the Narrow camera. The pixel pitch (size of one sensor pixel) is 12 μm for all six models that list it. For photo formats, the Mavic 3T and Matrice 4T list "JPEG (8-bit), R-JPEG (16-bit)", the Zenmuse H20T "R-JPEG (16-bit)" and the Zenmuse H30T "R-JPEG".
A few things that did not fit in the table:
- Range (low gain): Matrice 30T 0 to 500 °C (user manual v1.0), Mavic 3T 0 to 500 °C, Matrice 4T 0 to 550 °C, Zenmuse H20T -40 to 550 °C, Zenmuse H30T 0 to 600 °C (with the IR ND filter: high gain -20 to 450 °C, low gain 0 to 1600 °C), Skydio X10 -40 to 350 °C
- Measurement accuracy: Matrice 30T, Mavic 3T and Matrice 4T (high gain) list "±2 °C or ±2%, whichever is greater"; Matrice 4T (low gain) "±5 °C or ±3%, whichever is greater"; Skydio X10 "the larger of ±5 °C or 5%". A footnote in the Matrice 30 series specs notes that this accuracy was tested in a lab environment and is for reference only
- Measurement methods: the DJI models list spot and area measurement (the H30T also center-point measurement); the Skydio X10 lists spot meter and area measurement
"±2 °C or ±2%, whichever is greater" describes absolute accuracy. In inspections that look at how much warmer a spot is than its surroundings in the same image, such as facade delamination or PV module faults, consistent shooting conditions (sun, time, angle, emissivity, reflections) matter as much as absolute accuracy.
Can it measure temperature, or only show it?
Not every thermal image contains temperatures. A radiometric image stores per-pixel temperature data (or the raw values behind it) and the measurement settings at capture time, alongside the display picture. A display-only image cannot be turned back into temperatures from its colors.
With a radiometric image you can read the temperature under the cursor after the flight, or get the maximum and minimum along a line or inside an area. If your report states temperatures, this is a must.
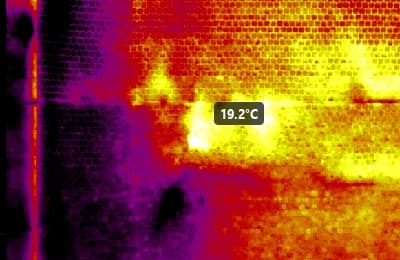
Check how the temperature data is read, not just the format name
If the spec sheet lists R-JPEG (radiometric JPEG), you can keep images with temperatures. But "R-JPEG" files from different manufacturers are structured differently. DJI R-JPEGs need DJI's Thermal SDK (or software that supports it) to extract temperatures. The Skydio X10, on the other hand, carries a Teledyne FLIR Boson+ and writes R-JPEGs compatible with the FLIR format.
Another catch: the display JPEG and the temperature data do not always have the same pixel count. For example, some DJI Matrice 30T images handled by CRITIR combine a 1280×1024 display JPEG with 640×512 temperature data. Judging the camera as "1280×1024" from the JPEG size alone overstates how fine the temperature data is.
For what is inside an R-JPEG and how manufacturers differ, see What is R-JPEG?.
Treat super-resolution and high-resolution modes as a different thing
Recent models offer modes that increase the number of pixels in thermal images. The official Matrice 4T specs list a 640×512 thermal sensor, and images become 1280×1024 with super-resolution on (for video, super-resolution is noted as unavailable in night mode). The Zenmuse H30T has a native 1280×1024 sensor and also supports UHR infrared images.
These modes look sharper, but their temperature data is not necessarily handled like normal images. In CRITIR, for example, images captured in a DJI thermal camera's High Res mode are in a format the DJI SDK does not officially support: their measurement parameters (emissivity, distance, etc.) cannot be changed and stay fixed to the capture settings, and temperatures are shown as reference values from a simplified decoder. Relative temperature differences can still be compared.
Do a test shot before the real job
When you use a new camera or a new mode, take a few images first and load them into the analysis software you plan to use. Checking that temperatures can be read, that emissivity can be corrected and that the visible image lines up saves you a return trip to the site.
The visible camera matters too
A thermal image alone cannot tell you whether a warm patch is delamination, dirt, a window reflection or heat from equipment. The basic approach is to compare it with the visible image taken at the same time and rule causes out. That is why every model in this comparison combines a thermal camera with visible cameras (which visible cameras — wide, narrow or telephoto — varies by model).
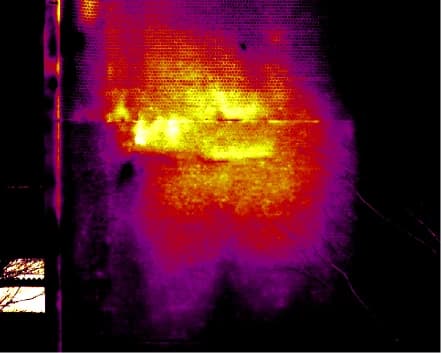
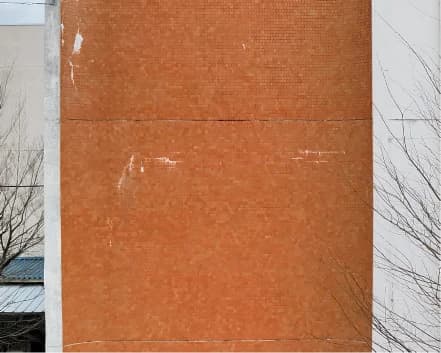
Keep in mind that the visible and thermal cameras use separate lenses. Their fields of view and resolutions differ, and the lenses sit slightly apart, so the two images do not line up as-is. More visible pixels make details easier to check, but using them together with thermal requires a way to align (register) the two images.
For distant structures a visible zoom camera helps too. Digital zoom on the thermal side, however, only enlarges the image; it does not add sensor pixels.
By application
Facades (tile, render)
Facade thermography needs enough detail to read the extent of delamination from the image. As the opening image shows, with fine pixels you can follow temperature boundaries tile by tile; with coarse pixels the extent blurs.
- For low-rise buildings you can fly close, so 640×512 often gives enough detail
- When you must shoot from far away (tall buildings, tight sites), higher resolution or a narrower FOV helps
- Steep upward angles stretch pixels on the wall. Shoot as square-on to the surface as you can
Timing and wall orientation affect the result even more than the camera. For why delamination shows up in thermal images at all, and how it flips between day and evening, see Why tile delamination shows up in thermal images.
Solar panels
For drone inspection of PV plants, IEC TS 62446-3 is described as calling for a resolution where one pixel covers at most 3 cm on the module surface (the standard itself is paywalled; this is based on manufacturer technical guidance and a review paper). Think about the tilted module surface, not the ground resolution.
Working backwards with the formula, a camera with a 61° diagonal FOV and 640×512 reaches 3 cm at about 20 m when square-on to the module surface. In practice modules are usually shot at an angle, so plan closer than that. You must shoot while the plant is generating, and because you compare temperature differences, a radiometric camera is essential. Details are in Solar panel thermal inspection.
Structures (chimneys, tanks, bridges)
These jobs often combine limited access, obstacles and the need to cover the whole circumference.
- The farther you shoot from, the larger each pixel gets, so resolution and FOV matter a lot
- For hot equipment, check the upper end of the low-gain range (from 350 °C to 600 °C depending on the model)
- You can also shoot all the way around and combine it into a single unwrapped image (Unwrapped images of chimneys and tanks)
After the flight: cameras CRITIR can read
When choosing a camera, decide which software will analyze the images as well. The thermal image analysis software CRITIR reads thermal images from different manufacturers as they are, with no conversion, and covers temperature reading, measurement, judgment and reporting.
Among drone cameras, CRITIR has been verified with the following models, including alignment with the visible images:
| Manufacturer | Models |
|---|---|
| DJI | Matrice 4T / 4TD, Zenmuse H30T, Mavic 3T, Matrice 30T, Zenmuse H20T / H20N, Mavic 2 Enterprise Advanced, Zenmuse XT2 (13 mm / 19 mm) |
| Skydio | X10 (VT300-Z) |
| Autel | EVO II Dual 640T (V3) |
The Zenmuse H30T, Mavic 3T, Matrice 30T and Zenmuse H20T also support precise alignment of the visible-thermal offset per shot. Note that images taken with the thermal camera's zoom cannot be aligned.
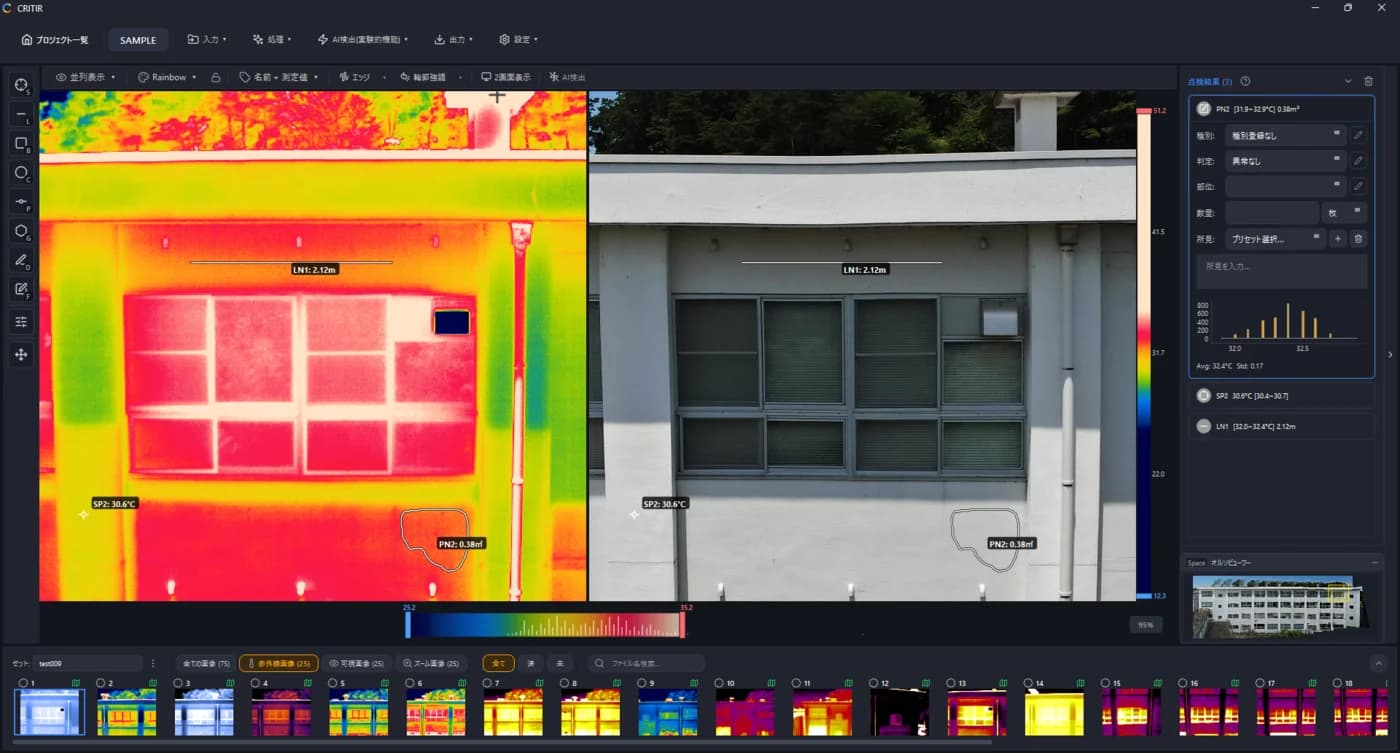
The full list, including handheld FLIR, HIKMICRO, Fluke, NEC Avio and testo cameras, is on Supported cameras, and temperature display and measurement parameters are covered in Thermal analysis. For product details, see the CRITIR product page.
Frequently asked questions
- Should I choose a 640×512 or a 1280×1024 drone thermal camera?
- Compare them by how many centimeters one pixel covers on the target, which combines resolution, field of view and shooting distance. With the same field of view, a 1280×1024 camera gives the same detail as a 640×512 camera at half the distance. Higher resolution pays off when you cannot get close to the structure or must shoot from far away; if you can fly close, 640×512 may be enough. Decide the detail you need first, then balance the distance it requires against the number of images and the flight time.
- How do I calculate the size of one pixel on the target?
- For a square-on shot, a good estimate near the image center is: distance × 2 × tan(diagonal FOV ÷ 2) ÷ number of pixels along the diagonal. For example, a camera with a 61° diagonal field of view and 640×512 pixels covers about 1.4 cm per pixel on a wall 10 m away, and about 2.9 cm at 20 m. Oblique shots stretch each pixel further on the surface, and lens distortion changes it toward the edges, so plan with some margin.
- Can every thermal camera measure temperatures after capture?
- No. Only images from a radiometric camera, which store per-pixel temperature data, let you read the temperature at any point afterwards. A colored display image alone cannot be converted back to temperatures. Check the spec sheet for temperature measurement modes and a radiometric photo format such as R-JPEG.
- Are super-resolution or high-resolution thermal images handled like normal ones?
- Not necessarily. For example, the official Matrice 4T specs list a 640×512 thermal sensor, and images become 1280×1024 when super-resolution is on. In CRITIR, images captured in a DJI thermal camera's High Res mode cannot have their measurement parameters such as emissivity changed, and temperatures are shown as reference values from a simplified decoder, because the DJI SDK does not officially support that format. Test how your analysis software handles the mode before the real job.
- Which drone thermal cameras does CRITIR support?
- CRITIR has been verified with the DJI Matrice 4T / 4TD, Zenmuse H30T, Mavic 3T, Matrice 30T, Zenmuse H20T / H20N, Mavic 2 Enterprise Advanced and Zenmuse XT2, the Skydio X10 (VT300-Z) and the Autel EVO II Dual 640T (V3), including alignment with the visible images. The supported cameras page has the latest list.
Summary
- Compare thermal cameras by centimeters per pixel on the target: distance × 2 × tan(diagonal FOV/2) ÷ diagonal pixels gives a good estimate
- More pixels and a narrower FOV give finer detail, but a narrow FOV covers less per image and means more images
- If the inspection deals with temperatures, a radiometric camera is required. Check the photo format and how temperatures are read (supported software)
- The display JPEG and the temperature data may differ in pixel count. Test super-resolution and high-resolution modes for how their temperature data is handled
- Confirm thermal anomalies against the visible image. Consider the visible camera's resolution and FOV, and how the two images will be aligned
Sources
- DJI, Matrice 30 Series specs
- DJI, Mavic 3 Enterprise Series specs
- DJI, Matrice 4 Series specs
- DJI, Zenmuse H20 Series specs
- DJI, Zenmuse H30 Series specs
- Skydio, Skydio X10 Technical Specs
- DJI, MATRICE 30 SERIES User Manual v1.0 (April 2022) — thermal resolution (640×512 normal, 1280×1024 super-resolution), pixel pitch and measurement range (downloads page)
- IEC TS 62446-3:2017, Photovoltaic (PV) systems – Requirements for testing, documentation and maintenance – Part 3: Photovoltaic modules and plants – Outdoor infrared thermography (IEC Webstore)
- FLIR, FLIR T500-Series Macro Mode: single-lens solution for imaging small targets — at least 3×3 pixels on the target for accurate measurement, ideally 10×10 or more
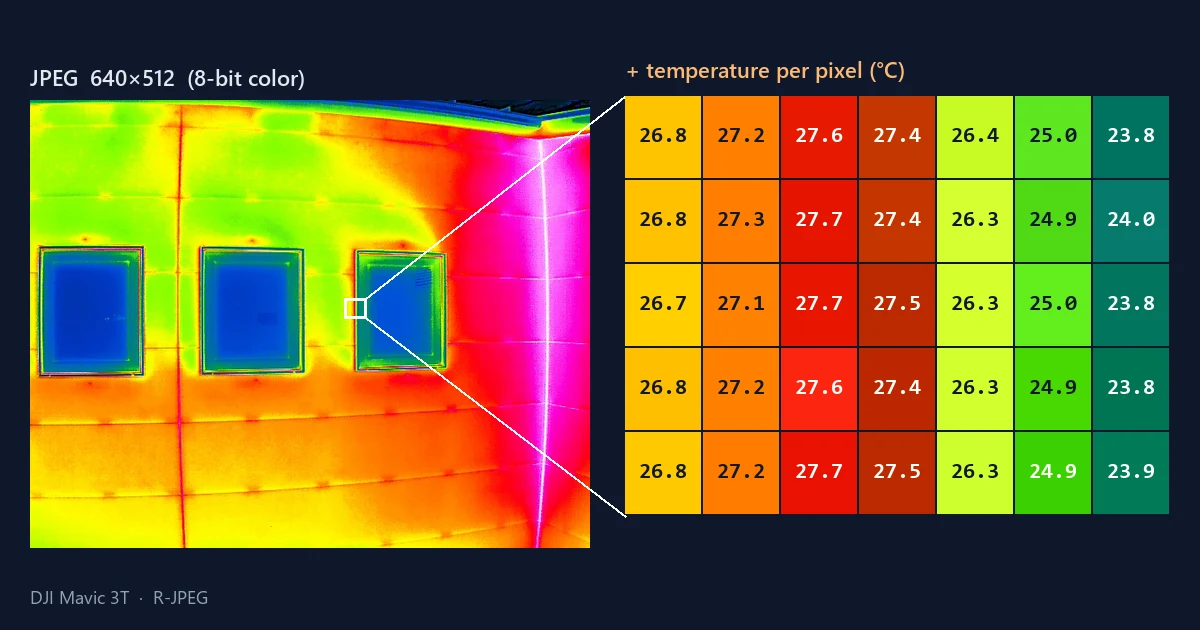
What is R-JPEG? Inside a drone thermal image — why the JPEG you see is not the temperature data
Open a DJI drone thermal image (R-JPEG) in an ordinary image viewer and all you get is a colored picture. This illustrated guide explains the three things packed into one file — the picture, the raw thermal data, and the calculation inputs — why you cannot read temperature from colors, why the JPEG and the thermal data can have different resolutions, how it differs from FLIR radiometric JPEGs, where the DJI Thermal SDK and DJI Thermal Analysis Tool fit, and what to know about High Res mode.
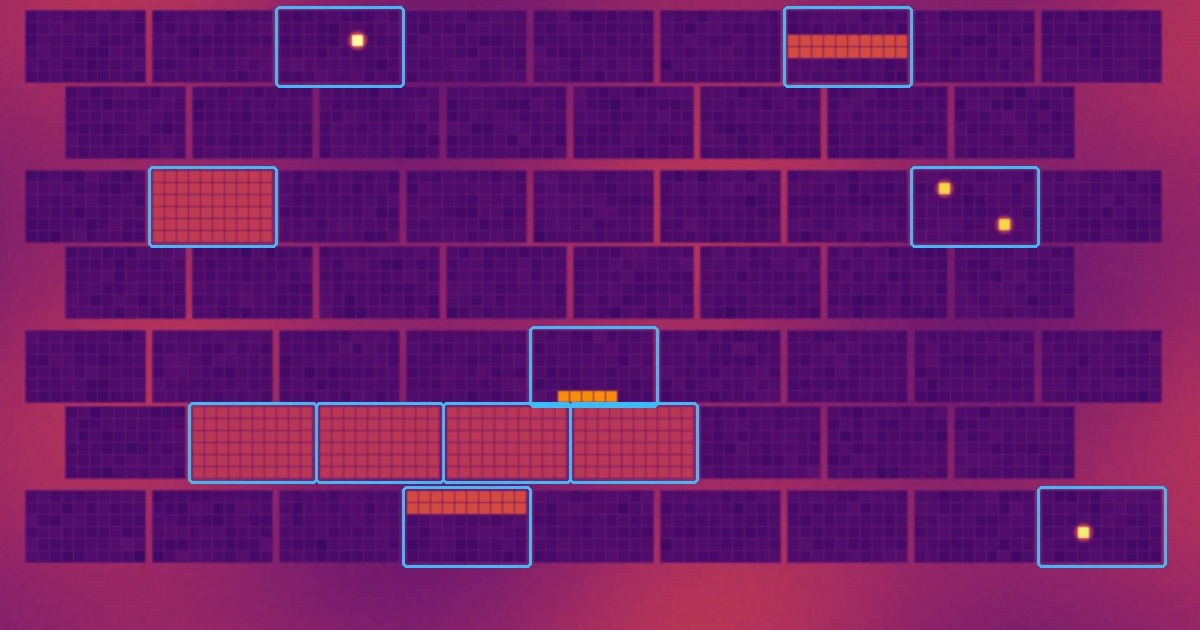
Solar panel infrared inspection: what causes hot spots and how to find them
Why do hot spots form on PV modules? This illustrated guide lines up the typical thermal patterns (cracked cells, soiling and shade, bypass diodes, whole strings down) by the shape they leave in a thermal image, then covers the capture conditions (600 W/m² irradiance, system operating, avoiding reflections), the drone inspection workflow, why an orthomosaic of the whole array helps, and what goes into the report, with IEC TS 62446-3 and industry guidelines as sources.
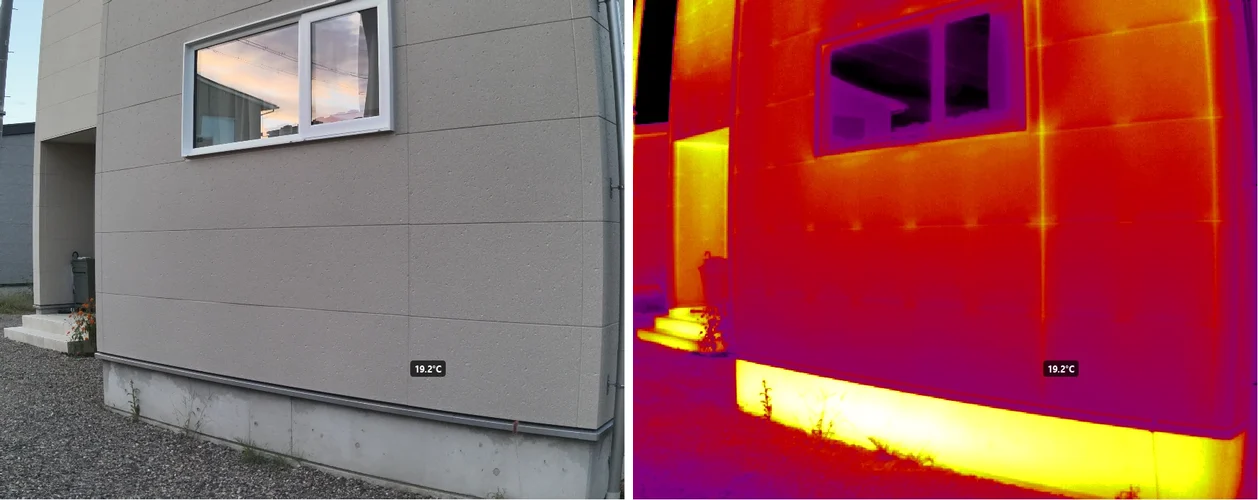
Emissivity and reflected temperature on thermal cameras: why your readings don't match, and how to fix them
Thermal camera readings that disagree with a contact thermometer, windows and metal that look impossibly cold — most of the time it is not a faulty camera but emissivity and reflected temperature settings. This guide explains what a thermal camera actually measures, lists typical emissivity values by material, shows how to measure reflected temperature with aluminum foil, and covers distance and humidity, why metal and glass are hard, and how to correct the settings after capture.